EUR/USD Intraday: the upside prevails.Pivot: 1.1395
Our preference: long positions above 1.1395 with targets at 1.1435 & 1.1465 in extension.
Alternative scenario: below 1.1395 look for further downside with 1.1380 & 1.1360 as targets.
Comment: the RSI shows upside momentum.

Opinion published is an intraday view. Green Lines Represent Resistance | Red Represent Support Levels | Light Blue is a Pivot Point | Black represents the price when the report was produced
GBP/USD Intraday: the upside prevails.Pivot: 1.2850
Our preference: long positions above 1.2850 with targets at 1.2900 & 1.2930 in extension.
Alternative scenario: below 1.2850 look for further downside with 1.2820 & 1.2785 as targets.
Comment: the RSI lacks downward momentum.

Opinion published is an intraday view. Green Lines Represent Resistance | Red Represent Support Levels | Light Blue is a Pivot Point | Black represents the price when the report was produced
AUD/USD Intraday: key resistance at 0.7260.Pivot: 0.7260
Our preference: short positions below 0.7260 with targets at 0.7235 & 0.7220 in extension.
Alternative scenario: above 0.7260 look for further upside with 0.7275 & 0.7300 as targets.
Comment: the RSI shows downside momentum.

Opinion published is an intraday view. Green Lines Represent Resistance | Red Represent Support Levels | Light Blue is a Pivot Point | Black represents the price when the report was produced
Gold spot Intraday: the bias remains bullish.Pivot: 1224.5000
Our preference: long positions above 1224.50 with targets at 1230.00 & 1233.00 in extension.
Alternative scenario: below 1224.50 look for further downside with 1222.00 & 1219.50 as targets.
Comment: a support base at 1224.50 has formed and has allowed for a temporary stabilisation.

Opinion published is an intraday view. Green Lines Represent Resistance | Red Represent Support Levels | Light Blue is a Pivot Point | Black represents the price when the report was produced
Silver spot Intraday: bullish bias above 14.4300.Pivot: 14.4300
Our preference: long positions above 14.4300 with targets at 14.5500 & 14.6200 in extension.
Alternative scenario: below 14.4300 look for further downside with 14.3800 & 14.3300 as targets.
Comment: even though a continuation of the consolidation cannot be ruled out, its extent should be limited.

Opinion published is an intraday view. Green Lines Represent Resistance | Red Represent Support Levels | Light Blue is a Pivot Point | Black represents the price when the report was produced
Technical analysis: Intraday level for USD/JPY for November 23, 2018
2018-11-23
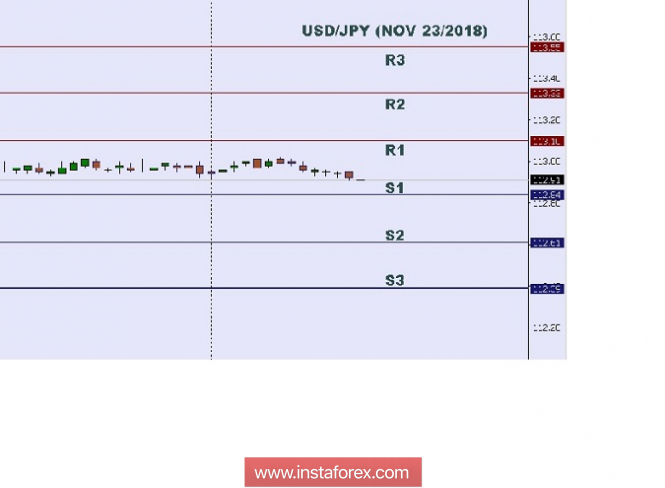
In Asia, Japan will release the Flash Manufacturing PMI and the US will publish some economic data such as Flash Services PMI, and Flash Manufacturing PMI. So there is a probability that the USD/JPY pair will move with a low to a medium volatility during this day. TODAY'S TECHNICAL LEVEL: Resistance. 3: 113.55. Resistance. 2: 113.33. Resistance. 1: 113.10. Support. 1: 112.84. Support. 2: 112.61. Support. 3: 112.39. Disclaimer: Trading Forex (foreign exchange) on margin carries a high level of risk, and may not be suitable for all Traders or Investors.The high degree of leverage can work against you as well as for you. Before deciding to invest in foreign exchange, you should carefully consider your investment objectives, level of experience, and risk appetite. The possibility exists that you could sustain a loss of some or all of your initial investment and therefore you should not invest money that you cannot afford to lose. You should be aware of all the risks associated with foreign exchange trading, and seek advice from an independent financial advisor if you have any doubts.
Technical analysis: Intraday Level For EUR/USD for November 23, 2018
2018-11-23
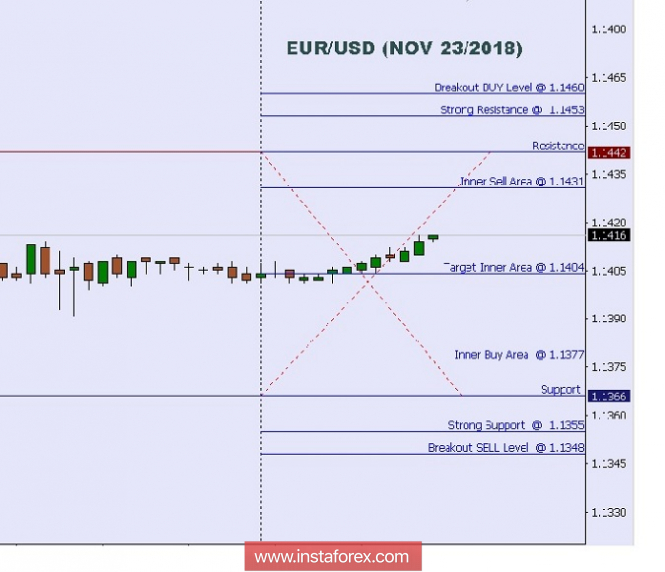
When the European market opens, some economic data will be released such as Belgian NBB Business Climate, Flash Services PMI, Flash Manufacturing PMI, German Flash Services PMI, German Flash Manufacturing PMI, French Flash Services PMI, French Flash Manufacturing PMI, and German Final GDP q/q. The US will also publish the economic data such as Flash Services PMI, and Flash Manufacturing PMI, so amid the reports, EUR/USD will move in a low to a medium volatility during this day. TODAY'S TECHNICAL LEVEL: Breakout BUY Level: 1.1460. Strong Resistance:1.1453. Original Resistance: 1.1442. Inner Sell Area: 1.1431. Target Inner Area: 1.1404. Inner Buy Area: 1.1377. Original Support: 1.1366. Strong Support: 1.1355. Breakout SELL Level: 1.1348. Disclaimer: Trading Forex (foreign exchange) on margin carries a high level of risk, and may not be suitable for all Traders or Investors. The high degree of leverage can work against you as well as for you. Before deciding to invest in foreign exchange, you should carefully consider your investment objectives, level of experience, and risk appetite. The possibility exists that you could sustain a loss of some or all of your initial investment and therefore you should not invest money that you cannot afford to lose. You should be aware of all the risks associated with foreign exchange trading, and seek advice from an independent financial advisor if you have any doubts.
GBP/JPY Approaching Resistance, Prepare For A Reversal
2018-11-23
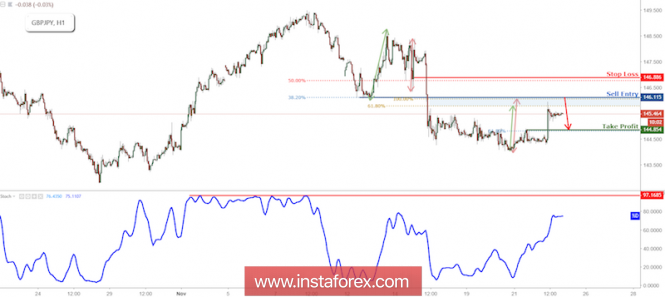
GBP/JPY is approaching its resistance at 146.11(100% & 61.8% Fibonacci extension, 38.2% Fibonacci retracement, horizontal pullback resistance) where it is expected to reverse down to its support at 144.85 (61.8% Fibonacci retracement, horizontal pullback support).
Stochastic (55, 5, 3) is approaching its resistance at 97% where a corresponding reversal is expected.
GBP/JPY is approaching its resistance where we expect to see a reversal.
Sell below 146.11. Stop loss 146.88. Take profit at 144.85.
Technical analysis for Gold for November 23, 2018
2018-11-23
Gold price remains below the important long-term resistance of $1,240-43.50. On a daily basis, price is making higher highs and higher lows for the last 3 months. If we see higher highs in November then we could expect much more upside in Gold prices. If the recent lows are broken, Gold will most probably push to new lows over the coming months.
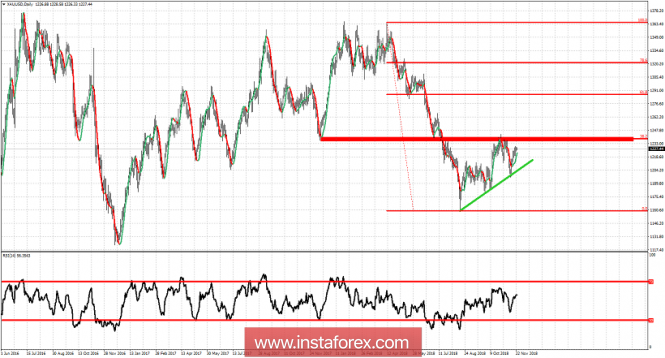
Green line - major trend line support
Red rectangle - long-term resistance
Gold price has so far peaked at the 38% Fibonacci retracement level and where we also find important previous lows which are now confirmed resistance. Gold bulls need to break above $1,240 major resistance and the road to $1,270-$1,300 will be open. On the contrary, bears need to break below the green trend line support and specially below $1,180. If this happens, we should expect Gold prices to move below $1,100 over the coming months.
Technical analysis for EUR/USD for November 23, 2018
2018-11-23
EUR/USD continues to trade above critical short-term support. The potential for a move towards 1.15 is still there. As long as we trade above 1.1380-1.1360, it is highly likely. Longer-term trend remains bearish targeting 1.10-1.08.
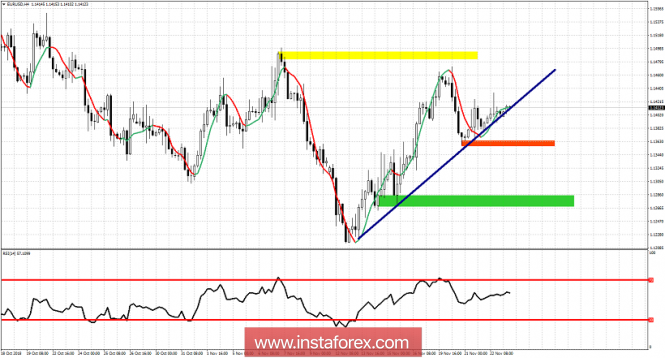
Yellow rectangle - resistance
Green rectangle - major support
Red rectangle- short-term support
Blue line - trend line support
EUR/USD is trading right along the blue trend line support. Breaking below it will be a bearish sign. However in order for bears to regain control of the short-term trend they will need to break below 1.1360 and the red rectangle area. Breaking below the green rectangle area will confirm the short-term bearish trend towards 1.10. So far we have not seen any bearish divergence sign. If the yellow rectangular area is tested, we might see one. Until then I remain neutral for the short-term.
Elliott wave analysis of EUR/JPY for November 23, 2018
2018-11-23
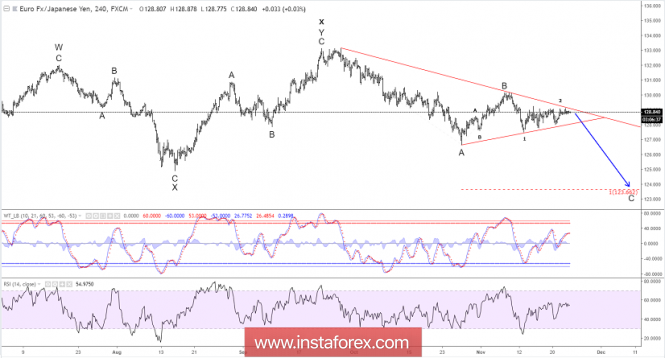
Another range-trading day. Likely due to the US Thanksgiving holiday and today only being half a work day. So we do not expect much action to be seen before the start of next week.
We continue to favor the bearish outcome and a break below support at 127.94 for a decline towards 123.66 to complete wave (E) and a long-term low being in place for the next impulsive rally.
Resistance is now seen at 129.05 and more importantly at 129.23. Only a break above the later, will invalidate our bearish view and call for a rally towards 130.13 on the way higher to 133.00.
R3: 130.13
R2: 129.40
R1: 129.06
Pivot: 128.90
S1: 128.40
S2: 128.00
S3: 127.74
Trading recommendation:
We are short EUR from 128.75 with our stop+revers placed at 129.50.
Elliott wave analysis of EUR/NZD for November 23, 2018
2018-11-23
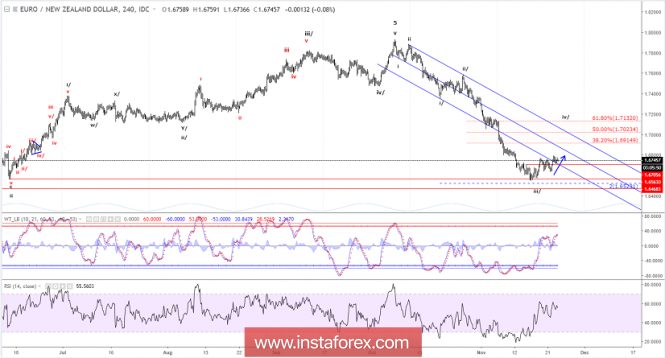
We are still looking for a clear break above minor resistance at 1.6767 for a continuation of the ongoing correction towards at least 1.6914 and likely even closer to resistance at 1.7023.
Only an unexpected break below support at 1.6683 and more importantly a break below support at 1.6560 will indicate that wave iv/ completed prematurely and wave v lower to 1.6250 already is unfolding.
R3: 1.6879
R2: 1.6836
R1: 1.6832
Pivot: 1.6767
S1: 1.6731
S2: 1.6706
S3: 1.6642
Trading recommendation:
We are long EUR from 1.6706 with our stop placed at 1.6555. We will raise our stop to break-even upon a break above 1.6767.


No comments:
Post a Comment