| Elliott wave analysis of EUR/JPY for November 30, 2018 2018-11-30 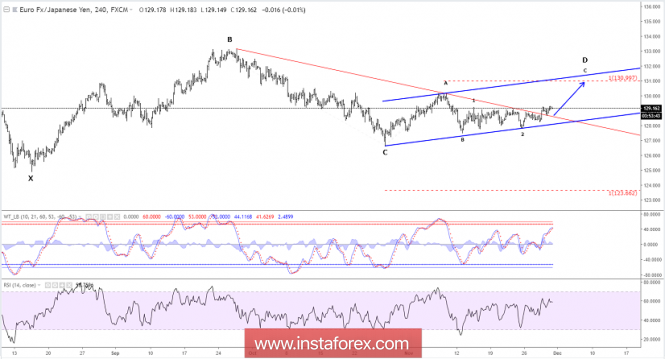
Under our new preferred count we should now be in wave c of D higher towards resistance in the 130.89 - 130.99 area. Ideally the final decline in wave E will start from here, but it's possible that wave c of D extends higher to 131.89 before tuning lower in wave E. We now see support at 128.64, which ideally will protect the downside for the next rally higher through resistance at 129.25 for the rally towards the 130.89 - 130.99 area. R3: 130.89 R2: 130.06 R1: 129.62 Pivot: 129.25 S1: 128.84 S2: 128.64 S3: 128.22 Trading recommendation: We are long EUR from 129.25 with our stop placed at 128.00. Upon a break above 129.30 we will move our stop higher to 123.50. We will take half profit at 130.75. Elliott wave analysis of EUR/NZD for November 30, 2018 2018-11-30 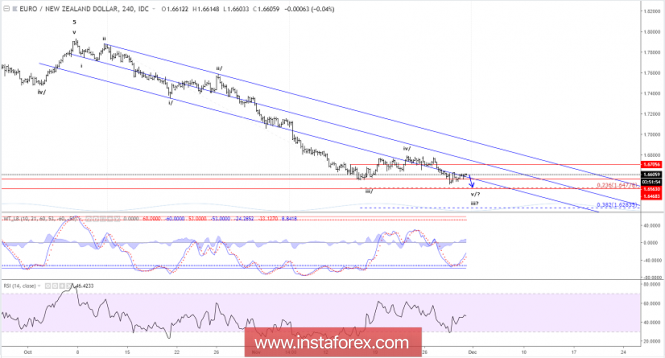
We continue to look for a final dip closer to 1.6478 to complete wave v/ and iii. This final dip should set the stage for a corrective rally in wave iv towards 1.6706 before the final decline in wave v towards 1.6235. This should complete the first impulsive decline from 1.7929 and set the stage for a larger corrective rally. Short-term resistance is seen at 1.6629, which ideally will cap the upside for a final dip to 1.6478. A break above 1.6629 could indicate wave iii has completed early, while a break above 1.6655 will confirm the low is in place for the corrective rally closer to 1.6706. R3: 1.6655 R2: 1.6629 R1: 1.6603 Pivot: 1.6587 S1: 1.6555 S2: 1.6514 S3: 1.6478 Trading recommendation: We will buy EUR at 1.6480 or upon a break above 1.6655. Technical analysis for Gold for November 30, 2018 2018-11-30 Gold price reached the recent highs around $1,230 again yesterday but was unable to break above resistance yet. Price is now pulling back once again confirming the importance of the short-term resistance area at $1,230. 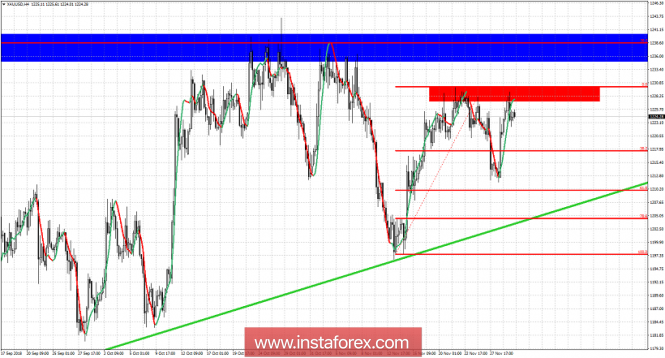
Blue rectangle- major resistance area Red rectangle - important short-term resistance Green line - major trend line support Gold price held the 61.8% Fibonacci retracement level and did not break below the green trend line support. These are two very important bullish signs. Not only that, but prices bounced strongly back towards last weeks highs at $1,230. Breaking above this resistance will be an important bullish sign for more upside. Target will then be a move to $1,250-60 at least. Major support area is now at $1,211-$1204. Breaking below this week's lows will be a bearish sign. Breaking below the green trend line support would increase the chances for a move much lower than $1,180. For now bulls keep the upper hand and as long as $1,203 holds. Technical analysis for EUR/USD for November 30, 2018 2018-11-30 Although longer-term trend remains bearish, short-term strength in EUR/USD will challenge the medium and long-term trend. Price is challenging important resistance at 1.14-1.1470 that if broken would push prices above 1.1530-1.1550. 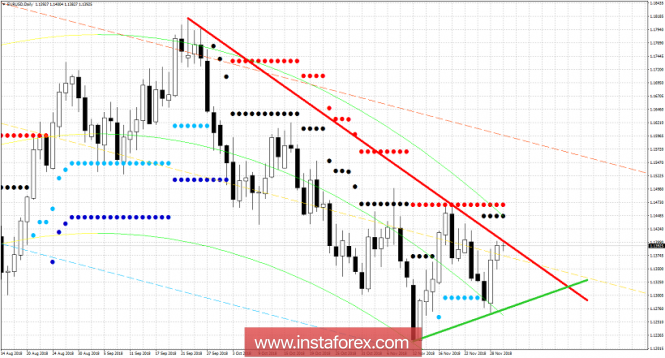
Red line -trend line resistance Green line- trend line support Black dots - resistance Red dots - major resistance level EUR/USD is challenging the resistance trend line at 1.14. Breaking above the trend line will push price towards 1.1460-1.1470 where the major resistance is found. A rejection at current levels would be a bearish sign. Short-term support that could signal a rejection if broken would be at 1.1350. Breaking below that level will most probably push price towards the green trend line support.
Author's today's articles: Torben Melsted  Born in November 1962. Graduated from CBS, got Diploma in Finance. Began trading on Forex in 1986 and since that time held various positions such as advising clients, hedging client flows on FX and commodity markets. Also worked for major corporations as Financial Risk Manager. Uses Elliott wave analysis in combination with classic technical analysis, and has been using a Calmar Ratio of 5.0 for over 3 years. Has his own blog, where he uses Elliott wave and technical analysis on all financial markets. Born in November 1962. Graduated from CBS, got Diploma in Finance. Began trading on Forex in 1986 and since that time held various positions such as advising clients, hedging client flows on FX and commodity markets. Also worked for major corporations as Financial Risk Manager. Uses Elliott wave analysis in combination with classic technical analysis, and has been using a Calmar Ratio of 5.0 for over 3 years. Has his own blog, where he uses Elliott wave and technical analysis on all financial markets. Alexandros Yfantis  Alexandros was born on September 14, 1978. He graduated from the ICMA Centre, University of Reading with the MSc in International Securities, investment and Banking in 2001. In 2000, Alexandros got the BSc in Economics and Business Finance from Brunel University, UK. In 2004, he began trading on the Greek stock market, where Alexandros got a specialization in international derivatives. Alexandros Yfantis has worked in a top financial company in Greece, responsible for the day-to-day running of the International markets department. He is a certified Portfolio Manager and a certified Derivatives Trader. Alexandros is also a contributor and analyst using Elliott wave and technical analysis of global financial markets. In 2007, he started Forex trading. He loves his profession and believes that entering a trade should always be accompanied by money management rules. His goal is to find profitable opportunities across the markets while minimizing risk and maximizing potential profit. "I'm still learning" Michelangelo Alexandros was born on September 14, 1978. He graduated from the ICMA Centre, University of Reading with the MSc in International Securities, investment and Banking in 2001. In 2000, Alexandros got the BSc in Economics and Business Finance from Brunel University, UK. In 2004, he began trading on the Greek stock market, where Alexandros got a specialization in international derivatives. Alexandros Yfantis has worked in a top financial company in Greece, responsible for the day-to-day running of the International markets department. He is a certified Portfolio Manager and a certified Derivatives Trader. Alexandros is also a contributor and analyst using Elliott wave and technical analysis of global financial markets. In 2007, he started Forex trading. He loves his profession and believes that entering a trade should always be accompanied by money management rules. His goal is to find profitable opportunities across the markets while minimizing risk and maximizing potential profit. "I'm still learning" Michelangelo
Subscription's options management
Theme's:
Fundamental analysis, Fractal analysis, Wave analysis, Technical analysis, Stock Markets
Author's :
Alexandros Yfantis, Arief Makmur, Dean Leo, Oscar Ton, Michael Becker, Mohamed Samy, Mourad El Keddani, Petar Jacimovic, Rocky Yaman, Sebastian Seliga, Torben Melsted
Edit data of subscription settings
Unsubscribe from the mailing list Sincerely,
Analysts Service | If you have any questions, you can make a phone call using one of the
InstaForex Toll free numbers right now:
|  | InstaForex Group is an international brand providing online trading services to the clients all over the world. InstaForex Group members include regulated companies in Europe, Russia and British Virgin Islands. This letter may contain personal information for access to your InstaForex trading account, so for the purpose of safety it is recommended to delete this data from the history. If you have received this letter by mistake, please contact InstaForex Customer Relations Department. |


No comments:
Post a Comment