| GBP/JPY Approaching Resistance, Prepare For Further Drop 2018-11-29 GBP/JPY is approaching its resistance at 146.04 (100% Fibonacci extension, 38.2% Fibonacci retracement, horizontal pullback resistance) where it is expected to drop further to its support at 144.84 (61.8% Fibonacci retracement, horizontal swing low support). Stochastic (55, 5, 3) reversed off its resistance at 96% where a corresponding drop is expected. GBP/JPY approaching its resistance where we expect to see a further drop. Sell below 146.04. Stop loss at 146.78. Take profit at 144.84. 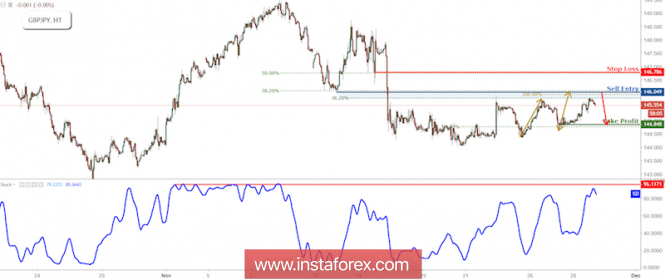
Technical analysis for Gold for November 29, 2018 2018-11-29 Gold price bounced strongly yesterday respecting the 61.8% Fibonacci retracement level we noted yesterday. Still with no clear medium-term trend, Gold is still below major resistance levels that if broken upwards could provide a strong bullish signal for a move towards $1,250-60. Bears need to break below yesterday lows in order to regain control of the trend. 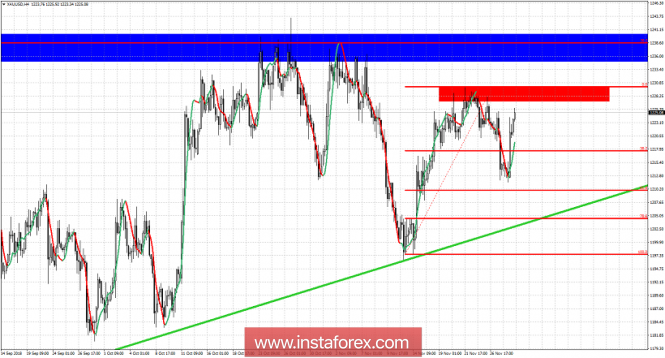
Blue rectangle - major resistance area Red rectangle - short-term important resistance area Green line - major support trend line Gold price pulled back towards our minimum target area of the 61.8% Fibonacci level. Prices bounced strongly and bulls are now challenging the important short-term resistance at $1,230 and recent highs. Breaking above this level will change my view to bullish. As we previously said, as long as price is above the green trend line support, bulls remain alive and have many changes to regain control of the medium-term trend. This will happen with a break above $1,230-40 area. Bears on the other hand are now defending the resistance. Yesterday's lows at $1,211 must be broken in order for bears to regain control of the trend. Elliott wave analysis of EUR/JPY for November 29, 2018 2018-11-29 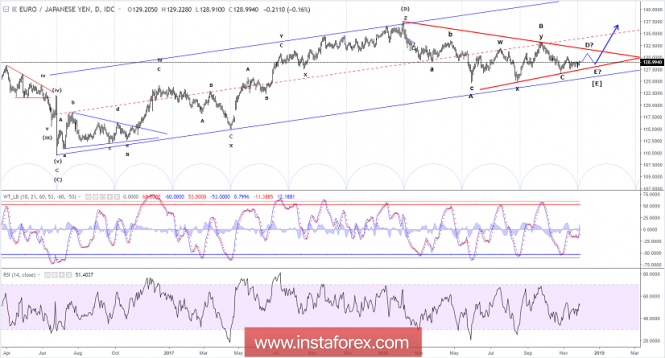
FED remarks of a pause in its rate hikes lifted the EUR and also lifted EUR/JPY past our pivot point at 129.00, which invalidated our bearish count. So we have been back to the drawing board to review the possible options and it looks more and more likely, that wave [E] itself is developing into a triangle. If this is the case, then we should see a rally towards 130.89 and maybe even closer to 131.89 in wave D and then a final dip in wave E to complete wave [E] of the huge triangle consolidation that has been developing since July 2008. R3: 130.89 R2: 130.06 R1: 129.62 Pivot: 129.23 S1: 128.84 S2: 128.59 S3: 128.22 Trading recommendation: Our stop+revers at 129.25 was hit for a small loss and we will place our new stop at 128.00 Technical analysis for EUR/USD for November 29, 2018 2018-11-29 EUR/USD bounced strongly yesterday breaking short-term resistance levels and putting bulls back in the game. However neither bulls nor bears are in control of the trend. As long as price is trading between 1.1410 and 1.1270 trend will be neutral. 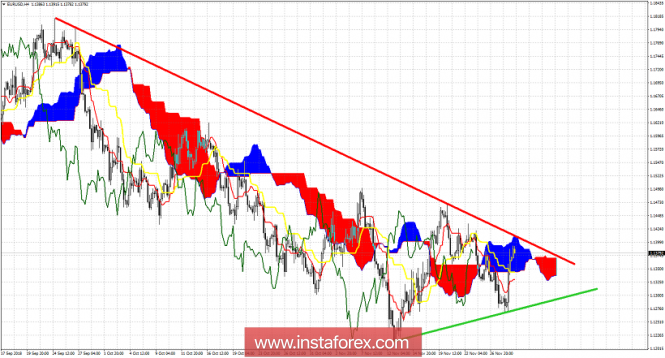
Red line - resistance trend line Green line - support trend line EUR/USD is challenging the 4-hour Kumo. Trend is neutral. Resistance is found at 1.1410 and support at 1.1340. Most important support level is at 1.1270. However if prices get rejected at current levels and fall below 1.1340, then I would expect 1.1270 to at least be tested if not broken. Breaking below 1.1270 will open the way for 1.11-1.10. Breaking above 1.1410 will open the way for a move towards 1.15-1.16. Elliott wave analysis of EUR/NZD for November 29, 2018 2018-11-29 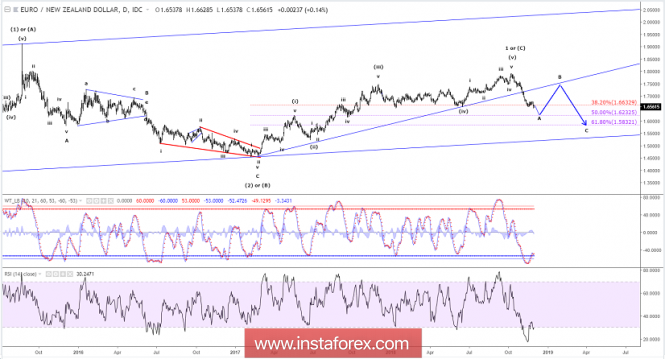
With the break below 1.6676 it was confirmed that wave iv/ completed early and a new low below 1.6539 closer to 1.6478 should be expected in the short term. This is exactly what we have seen. A new low below 1.6539, but not yet a test of 1.6478, but we expect to see a final dip closer to this target soon to complete wave v/ and iii. This should set the stage for a corrective rally in wave iv towards 1.6767 before the final dip towards 1.6235 as the ideal target for the decline from 1.7929 R3: 1.6676 R2: 1.6628 R1: 1.6603 Pivot: 1.6587 S1: 1.6555 S2: 1.6514 S3: 1.6478 Trading recommendation: Our stop at 1.6555 was hit. We will stay on the sideline for now.
Author's today's articles: Dean Leo  Dean Leo lives in Singapore and graduated from the prestigious Nanyang Technological University. He worked previously at Standard Chartered in the risk management team and went on to build his own proprietary trading systems. He now works at the top investment research house providing technical analysis to the largest banks and hedge funds in different countries. Dean's approach utilizes 3 components to provide detailed and easy to understand analysis: graphical elements, mathematical indicators, Elliott structure. All 3 of these components are in line to create a holistic analysis on each currency pair. Dean Leo lives in Singapore and graduated from the prestigious Nanyang Technological University. He worked previously at Standard Chartered in the risk management team and went on to build his own proprietary trading systems. He now works at the top investment research house providing technical analysis to the largest banks and hedge funds in different countries. Dean's approach utilizes 3 components to provide detailed and easy to understand analysis: graphical elements, mathematical indicators, Elliott structure. All 3 of these components are in line to create a holistic analysis on each currency pair. Alexandros Yfantis  Alexandros was born on September 14, 1978. He graduated from the ICMA Centre, University of Reading with the MSc in International Securities, investment and Banking in 2001. In 2000, Alexandros got the BSc in Economics and Business Finance from Brunel University, UK. In 2004, he began trading on the Greek stock market, where Alexandros got a specialization in international derivatives. Alexandros Yfantis has worked in a top financial company in Greece, responsible for the day-to-day running of the International markets department. He is a certified Portfolio Manager and a certified Derivatives Trader. Alexandros is also a contributor and analyst using Elliott wave and technical analysis of global financial markets. In 2007, he started Forex trading. He loves his profession and believes that entering a trade should always be accompanied by money management rules. His goal is to find profitable opportunities across the markets while minimizing risk and maximizing potential profit. "I'm still learning" Michelangelo Alexandros was born on September 14, 1978. He graduated from the ICMA Centre, University of Reading with the MSc in International Securities, investment and Banking in 2001. In 2000, Alexandros got the BSc in Economics and Business Finance from Brunel University, UK. In 2004, he began trading on the Greek stock market, where Alexandros got a specialization in international derivatives. Alexandros Yfantis has worked in a top financial company in Greece, responsible for the day-to-day running of the International markets department. He is a certified Portfolio Manager and a certified Derivatives Trader. Alexandros is also a contributor and analyst using Elliott wave and technical analysis of global financial markets. In 2007, he started Forex trading. He loves his profession and believes that entering a trade should always be accompanied by money management rules. His goal is to find profitable opportunities across the markets while minimizing risk and maximizing potential profit. "I'm still learning" Michelangelo Torben Melsted  Born in November 1962. Graduated from CBS, got Diploma in Finance. Began trading on Forex in 1986 and since that time held various positions such as advising clients, hedging client flows on FX and commodity markets. Also worked for major corporations as Financial Risk Manager. Uses Elliott wave analysis in combination with classic technical analysis, and has been using a Calmar Ratio of 5.0 for over 3 years. Has his own blog, where he uses Elliott wave and technical analysis on all financial markets. Born in November 1962. Graduated from CBS, got Diploma in Finance. Began trading on Forex in 1986 and since that time held various positions such as advising clients, hedging client flows on FX and commodity markets. Also worked for major corporations as Financial Risk Manager. Uses Elliott wave analysis in combination with classic technical analysis, and has been using a Calmar Ratio of 5.0 for over 3 years. Has his own blog, where he uses Elliott wave and technical analysis on all financial markets.
Subscription's options management
Theme's:
Fundamental analysis, Fractal analysis, Wave analysis, Technical analysis, Stock Markets
Author's :
Alexandros Yfantis, Arief Makmur, Dean Leo, Harsh Japee, Michael Becker, Mohamed Samy, Mourad El Keddani, Petar Jacimovic, Rocky Yaman, Sebastian Seliga, Torben Melsted
Edit data of subscription settings
Unsubscribe from the mailing list Sincerely,
Analysts Service | If you have any questions, you can make a phone call using one of the
InstaForex Toll free numbers right now:
|  | InstaForex Group is an international brand providing online trading services to the clients all over the world. InstaForex Group members include regulated companies in Europe, Russia and British Virgin Islands. This letter may contain personal information for access to your InstaForex trading account, so for the purpose of safety it is recommended to delete this data from the history. If you have received this letter by mistake, please contact InstaForex Customer Relations Department. |


No comments:
Post a Comment