| Elliott wave analysis of EUR/JPY for November 28, 2018 2018-11-28 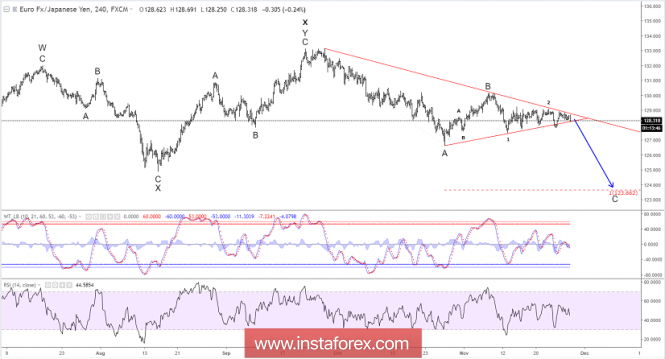
The resistance line from 133.12 has once again rejected the rally in EUR/JPY and is pushing prices lower. However, we need a clear break below support at 127.80 to confirm the next decline towards 123.66 is developing. The risk remains a break above resistance at 129.00 that will invalidate the bearish outlook and indicate a new rally towards 130.06 and 133.12. R3: 130.13 R2: 129.23 R1: 129.06 Pivot: 128.90 S1: 128.40 S2: 128.00 S3: 127.74 Trading recommendation: We are short EUR from 128.75 we will lower our stop+revers to 129.25. Elliott wave analysis of EUR/NZD for November 28, 2018 2018-11-28 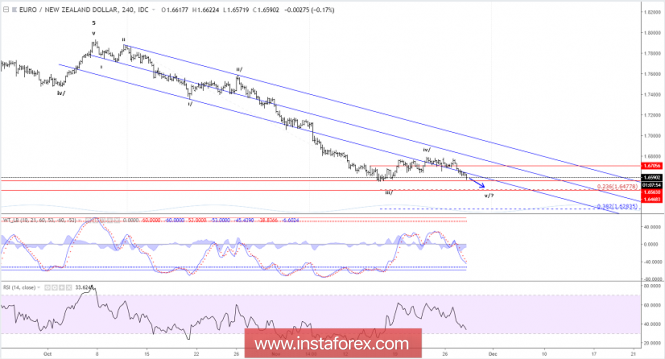
The break below minor support at 1.6676 is of concern and indicates that wave iv/ completed prematurely with the test of 1.6782 and wave v/ lower to at least 1.6478 already is developing. A break below support at 1.6561 will confirm that wave iv/ already has completed and wave v/ now is developing. Short-term, it will take a break above minor resistance at 1.6668 to ease the downside pressure, while a break above resistance at 1.6767 remains needed to confirm a rally towards 1.7023. R3: 1.6767 R2: 1.6697 R1: 1.6668 Pivot: 1.6626 S1: 1.6561 S2: 1.6539 S3: 1.6478 Trading recommendation: We are long EUR from 1.6706 with our stop placed at 1.6555. EUR/USD analysis for November 28, 2018 2018-11-28 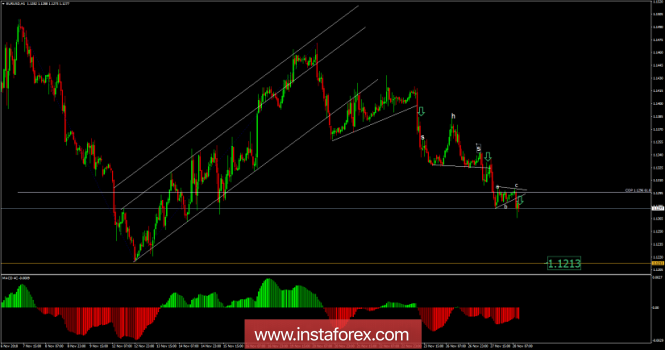
Recently, the EUR/USD pair has been trading downwards. As I expected, the price tested the level of 1.1266. According to the H1 time – frame, I have found the potential end of the upward correction (contracted flat), which is a sign that buying looks risky. I have also found a short – term bearish trend, which is another sign of weakness. My advice is to follow the direction of the trend. Watch for selling opportunities. The downward target is set at the price of 1.1213. GBP/USD analysis for November 28, 2018 2018-11-28 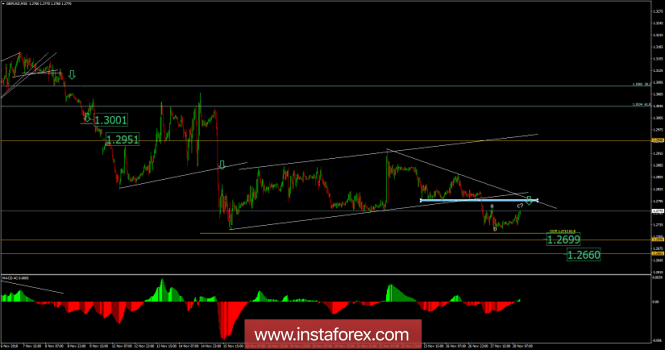
Recently, the GBP/USD pair has been trading upwards. The price tested the level of 1.2770. According to the M30 time – frame, I found that GBP/USD is in an upward correction phase and that buying at this stage looks risky. I also found that price is still trading below the downward trendline, which suggests downward trend. My advice is to follow the direction of the trend. Watch for selling opportunities. The downward targets are set at the price of 1.2700 and at the price of 1.2660. Technical analysis of EUR/USD for November 28, 2018 2018-11-28 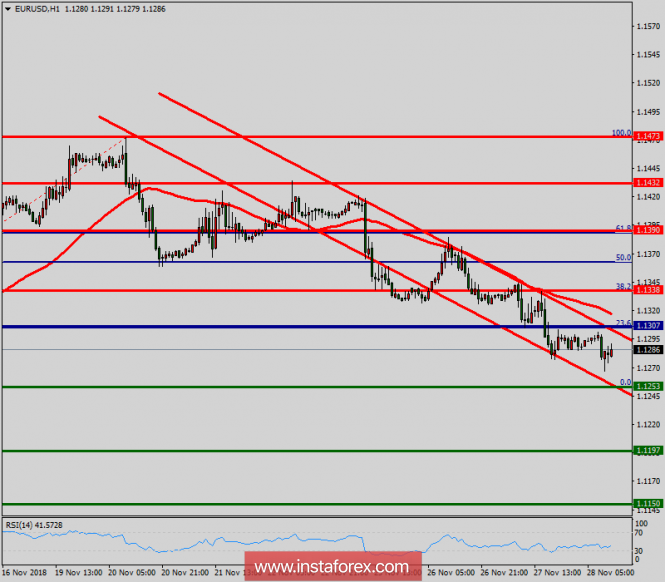 Overview: The EUR/USD pair fell from the level of 1.1338 towards 1.1265. Now, the price is set at 1.1288. The resistance is seen at the level of 1.1338 and 1.1390. Moreover, the price area of 1.1390/1.1338 remains a significant resistance zone. Therefore, there is a possibility that the EUR/USD pair will move downside and the structure of a fall does not look corrective. The trend is still below the 100 EMA for that the bearish outlook remains the same as long as the 100 EMA is headed to the downside. Thus, amid the previous events, the price is still moving between the levels of 1.1338 and 1.1253. If the EUR/USD pair fails to break through the resistance level of 1.1338, the market will decline further to 1.1253 as as the first target. This would suggest a bearish market because the RSI indicator is still in a negative spot and does not show any trend-reversal signs. The pair is expected to drop lower towards at least 1.1197 so as to test the daily support 2. On the contrary, if a breakout takes place at the resistance level of 1.1338, then this scenario may become invalidated. Technical analysis of AUD/USD for November 28, 2018 2018-11-28 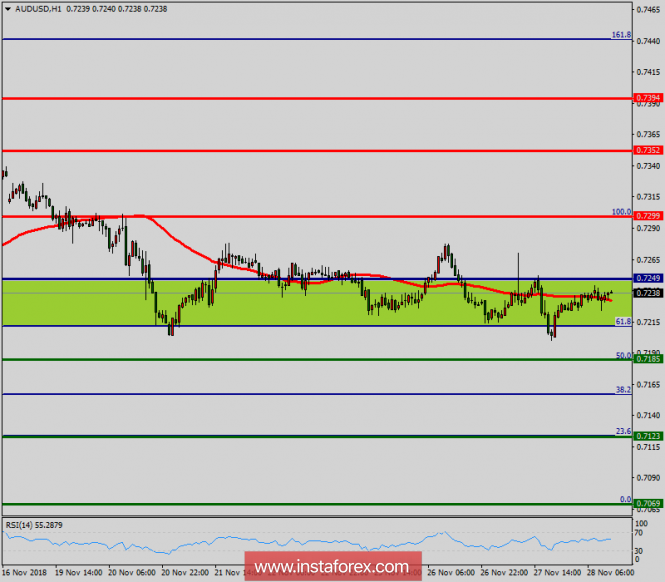 Overview: The AUD/USD pair continue to trade upwards from the level of 0.7225. This week, the pair rose from the level of 0.7225 to a top around 0.7299 but it rebounded to set around the spot of 0.7242. Today, the first resistance level is seen at 0.7299 followed by 0.7352, while daily support 1 is seen at 0.7185 (50% Fibonacci retracement). According to the previous events, the AUD/USD pair is still moving between the levels of 0.7250 and 0.7352; so we expect a range of 102 pips. Furthermore, if the trend is able to break out through the first resistance level at 0.7299, we should see the pair climbing towards the double top (0.7299) to test it. Therefore, buy above the level of 0.7299 with the first target at 0.7352 in order to test the daily resistance 1 and further to 0.7394. Also, it might be noted that the level of 0.7394 is a good place to take profit because it will form a double top. On the other hand, in case a reversal takes place and the AUD/USD pair breaks through the support level of 0.7185, a further decline to 0.7069 can occur which would indicate a bearish market. Intraday technical levels and trading recommendations for EUR/USD for November 28, 2018 2018-11-28 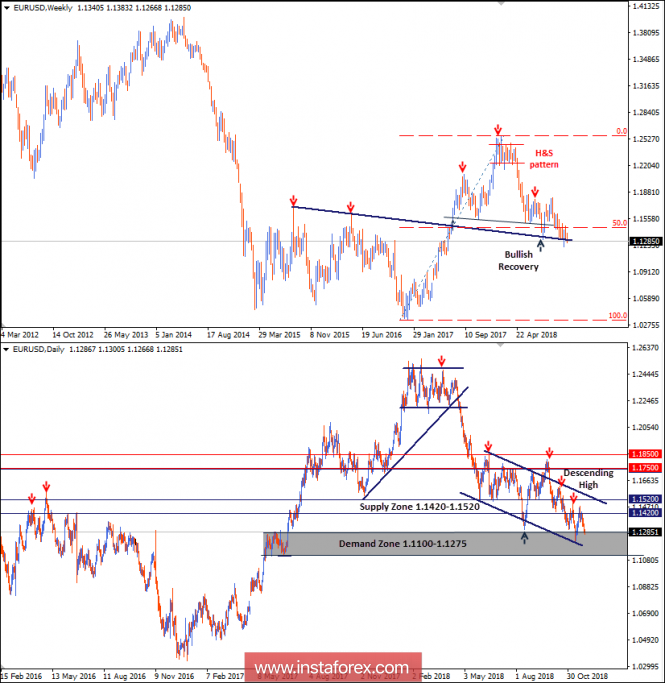
On the weekly chart, the EUR/USD pair is demonstrating a high-probability Head and Shoulders reversal pattern where the right shoulder is currently in progress. On the Daily chart, the pair has been moving sideways with slight bearish tendency. Recent bearish movement is maintained within the depicted daily movement channel. On November 13, the EUR/USD demonstrated recent bullish recovery around 1.1220-1.1250 where the lower limit of the channel as well as the depicted demand zone came to meet the pair. Quick bullish advancement was demonstrated towards 1.1420. To be noted that prominent supply zone as well as the previous wave high are located around 1.1420-1.1520. Bullish fixation above 1.1420 was needed to enhance further bullish movement towards 1.1520. However, the market demonstrated significant bearish rejection (shooting-star weekly candlestick). The EUR/USD pair remains under bearish pressure below 1.1420. The nearest demand level to meet the pair is located around 1.1170 where the lower limit of the depicted channel is roughly located. A quick decline was expected towards 1.1270 and probably the price zone of 1.1170-1.1150 would be visited soon if early bearish breakout below 1.1270 is achieved on lower timeframes. Intraday technical levels and trading recommendations for GBP/USD for November 28, 2018 2018-11-28 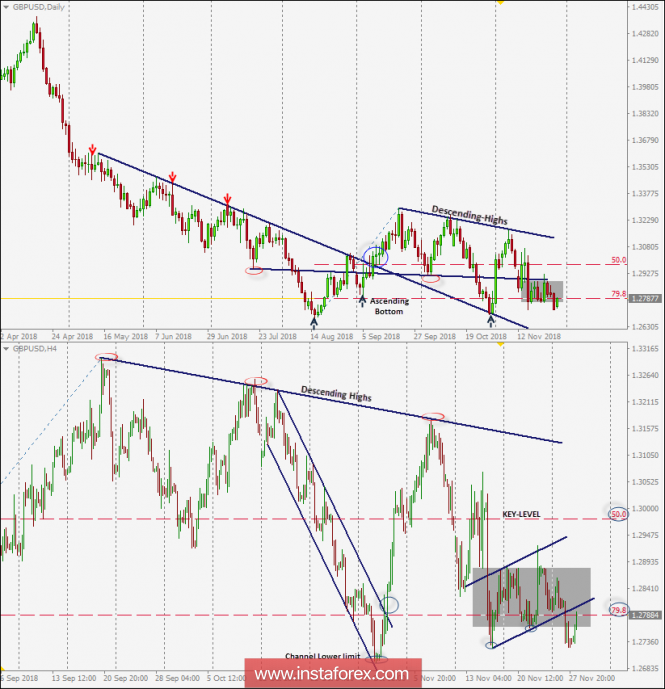
On September 21, the GBP/USD failed to demonstrate sufficient bullish momentum above 1.3296. Since then, the short-term outlook turned to become bearish under the depicted daily downtrend. On H4 chart, the GBP/USD pair looked oversold around the price levels of 1.2700 where profitable BUY entries were suggested. A Quick bullish movement was demonstrated towards the price level of 1.3170-1.3200 where another descending high around the depicted downtrend was established. This initiated the current bearish pullback towards the depicted consolidation-zone of (1.2750-1.2880) where the current sideway movement within the depicted H4 channel was initiated. Recently, the GBP/USD pair failed to establish a successful bullish breakout above the price level of 1.2880 (the upper limit of the current consolidation range). Moreover, a quick bearish decline was demonstrated towards the price zone around 1.2750 The current scenario may pursue a bearish flag continuation pattern provided that bearish persistence below 1.2750 is maintained on a daily basis. Projected target for the bearish flag continuation pattern is initially located around 1.2600.
Author's today's articles: Torben Melsted  Born in November 1962. Graduated from CBS, got Diploma in Finance. Began trading on Forex in 1986 and since that time held various positions such as advising clients, hedging client flows on FX and commodity markets. Also worked for major corporations as Financial Risk Manager. Uses Elliott wave analysis in combination with classic technical analysis, and has been using a Calmar Ratio of 5.0 for over 3 years. Has his own blog, where he uses Elliott wave and technical analysis on all financial markets. Born in November 1962. Graduated from CBS, got Diploma in Finance. Began trading on Forex in 1986 and since that time held various positions such as advising clients, hedging client flows on FX and commodity markets. Also worked for major corporations as Financial Risk Manager. Uses Elliott wave analysis in combination with classic technical analysis, and has been using a Calmar Ratio of 5.0 for over 3 years. Has his own blog, where he uses Elliott wave and technical analysis on all financial markets. Petar Jacimovic  Petar was born on July 08, 1989 in Serbia. Graduated from Economy University and after has worked as a currency analyst for large private investors. Petar has been involved in the world of finance since 2007. In this trading he specializes in Volume Price Action (volume background, multi Fibonacci zones, trend channels, supply and demand). He also writes the market analytical reviews for Forex forums and websites. Moreover Petar is forex teacher and has wide experience in tutoring and conducting webinars. Interests : finance, travelling, sports, music "The key to success is hard work" Petar was born on July 08, 1989 in Serbia. Graduated from Economy University and after has worked as a currency analyst for large private investors. Petar has been involved in the world of finance since 2007. In this trading he specializes in Volume Price Action (volume background, multi Fibonacci zones, trend channels, supply and demand). He also writes the market analytical reviews for Forex forums and websites. Moreover Petar is forex teacher and has wide experience in tutoring and conducting webinars. Interests : finance, travelling, sports, music "The key to success is hard work" Mourad El Keddani  Was born in Oujda, Morocco. Currently lives in Belgium. In 2003 obtained B.S. in Experimental Sciences. In 2007 obtained a graduate diploma at Institut Marocain Specialise en Informatique Applique (IMSIA), specialty – Software Engineering Analyst. In 2007–2009 worked as teacher of computer services and trainer in a professional school specializing in computer technologies and accounting. In 2005 started Forex trading. Authored articles and analytical reviews on Forex market on Forex websites and forums. Since 2008 performs Forex market research, and develops and implements his own trading strategies of Forex analysis (especially in Forex Research & Analysis, Currency Forecast, and Recommendations and Analysis) that lies in: Numerical analysis: Probabilities, equations and techniques of applying Fibonacci levels. Classical analysis: Breakout strategy and trend indicators. Uses obtained skills to manage traders' accounts since 2009. In April 2009 was certified Financial Technician by the International Federation of Technical Analysts. Winner of several social work awards: Education Literacy and Non-Formal Education (in Literacy and Adult Education in The National Initiative for Human Development). Was born in Oujda, Morocco. Currently lives in Belgium. In 2003 obtained B.S. in Experimental Sciences. In 2007 obtained a graduate diploma at Institut Marocain Specialise en Informatique Applique (IMSIA), specialty – Software Engineering Analyst. In 2007–2009 worked as teacher of computer services and trainer in a professional school specializing in computer technologies and accounting. In 2005 started Forex trading. Authored articles and analytical reviews on Forex market on Forex websites and forums. Since 2008 performs Forex market research, and develops and implements his own trading strategies of Forex analysis (especially in Forex Research & Analysis, Currency Forecast, and Recommendations and Analysis) that lies in: Numerical analysis: Probabilities, equations and techniques of applying Fibonacci levels. Classical analysis: Breakout strategy and trend indicators. Uses obtained skills to manage traders' accounts since 2009. In April 2009 was certified Financial Technician by the International Federation of Technical Analysts. Winner of several social work awards: Education Literacy and Non-Formal Education (in Literacy and Adult Education in The National Initiative for Human Development).
Languages: Arabic, English, French and Dutch.
Interests: Algorithm, Graphics, Social work, Psychology and Philosophy. Mohamed Samy  Born November 18, 1966, in Egypt. In 1990 graduated from the Faculty Of Engineering, Alexandria University. In 2000 started to follow financial markets. Took a higher diploma in investing and finance in 2008 and also CMT in 2009. Started at the Financial World as an analyst, then worked as a technical analysis consultant at Misr Financial Investments Co. Since 2005 has been working on the Stock Exchange. Has been familiar with Forex since December 2005. Being a member of the Egyptian Society of Technical Analysis, attends seminars and conferences dedicated to financial markets. Is a member of the American Market Technicians Association. Interests: football, reading, volleyball, swimming, movies Born November 18, 1966, in Egypt. In 1990 graduated from the Faculty Of Engineering, Alexandria University. In 2000 started to follow financial markets. Took a higher diploma in investing and finance in 2008 and also CMT in 2009. Started at the Financial World as an analyst, then worked as a technical analysis consultant at Misr Financial Investments Co. Since 2005 has been working on the Stock Exchange. Has been familiar with Forex since December 2005. Being a member of the Egyptian Society of Technical Analysis, attends seminars and conferences dedicated to financial markets. Is a member of the American Market Technicians Association. Interests: football, reading, volleyball, swimming, movies
Subscription's options management
Theme's:
Fundamental analysis, Fractal analysis, Wave analysis, Technical analysis, Stock Markets
Author's :
Alexandros Yfantis, Arief Makmur, Dean Leo, Harsh Japee, Michael Becker, Mohamed Samy, Mourad El Keddani, Petar Jacimovic, Rocky Yaman, Sebastian Seliga, Torben Melsted
Edit data of subscription settings
Unsubscribe from the mailing list Sincerely,
Analysts Service | If you have any questions, you can make a phone call using one of the
InstaForex Toll free numbers right now:
|  | InstaForex Group is an international brand providing online trading services to the clients all over the world. InstaForex Group members include regulated companies in Europe, Russia and British Virgin Islands. This letter may contain personal information for access to your InstaForex trading account, so for the purpose of safety it is recommended to delete this data from the history. If you have received this letter by mistake, please contact InstaForex Customer Relations Department. |


No comments:
Post a Comment