Technical analysis of AUD/USD for November 22, 2018
2018-11-22

Overview:
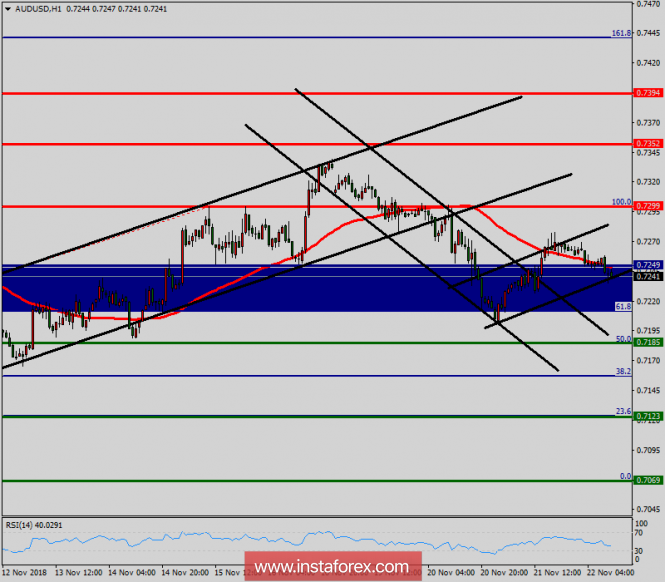
The AUD/USD pair keeps going to move upwards from the level of 0.7185. This week, the pair rose from the level of 0.7185 to a top around 0.7299 but it rebounded to set around the spot of 0.7242. Today, the first resistance level is seen at 0.7299 followed by 0.7352, while daily support 1 is seen at 0.7185 (50% Fibonacci retracement). According to the previous events, the AUD/USD pair is still moving between the levels of 0.7250 and 0.7352; so we expect a range of 102 pips. Furthermore, if the trend is able to break out through the first resistance level at 0.7299, we should see the pair climbing towards the double top (0.7299) to test it. Therefore, buy above the level of 0.7299 with the first target at 0.7352 in order to test the daily resistance 1 and further to 0.7394. Also, it might be noted that the level of 0.7394 is a good place to take profit because it will form a double top. On the other hand, in case a reversal takes place and the AUD/USD pair breaks through the support level of 0.7185, a further decline to 0.7069 can occur which would indicate a bearish market.
USD/JPY analysis for November 22, 2018
2018-11-22

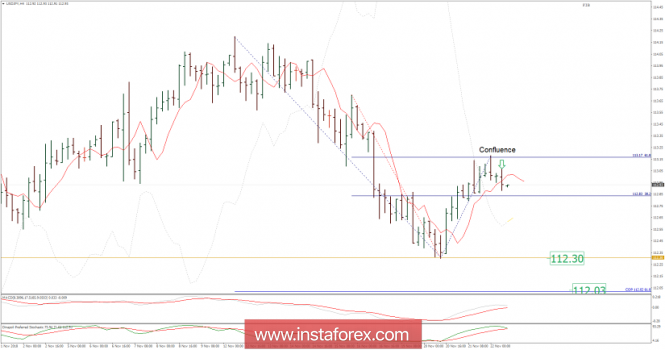
Recently, the USD/JPY pair has been trading sideways at the price of 112.91. Anyway, according to the H4 time – frame, I have found rejection of the key resistance (confluence level) at the price of 113.17 (Multi Fibonacci level), which is a sign that buying looks risky. I have also found that price went below the 3 DMA, which is another sign of weakness. My advice is to watch for selling opportunities. The downward targets are set at the price of 112.30 and at the price of 112.05.
Technical analysis of NZD/USD for November 22, 2018
2018-11-22

Overview:
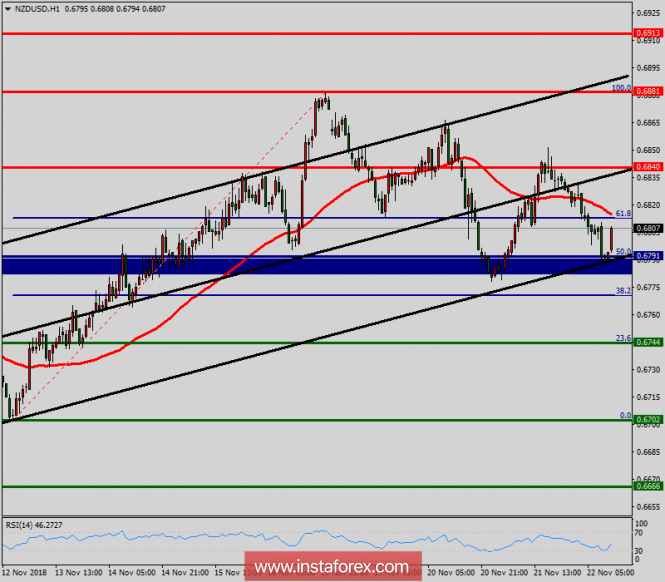
The NZD/USD pair will continue rising from the level of 0.6791 today. So, the support is found at the level of 0.6791, which represents the 50% Fibonacci retracement level in the H1 time frame. Since the trend is above the 50% Fibonacci level, the market is still in an uptrend. Therefore, the NZD/USD pair is continuing with a bullish trend from the new support of 0.6791. The current price is set at the level of 0.6791 that acts as a daily pivot point seen at 0.6791 also. Equally important, the price is in a bullish channel. According to the previous events, we expect the NZD/USD pair to move between 0.6791 and 0.6840. Therefore, strong support will be formed at the level of 0.6791 providing a clear signal to buy with the targets seen at 0.6840. If the trend breaks the support at 0.6730 (first resistance), the pair will move upwards continuing the development of the bullish trend to the level 0.6881 in order to test the double top. In the same time frame, support is seen at the levels of 0.6791 and 0.6744. The stop loss should always be taken into account for that it will be reasonable to set your stop loss at the level of 0.6744.
AUD/USD analysis for November 22, 2018
2018-11-22

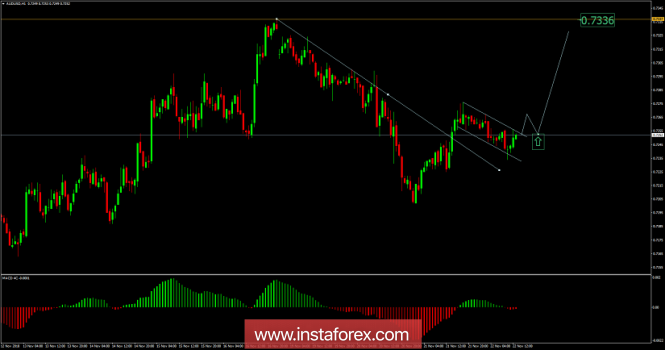
Recently, the AUD/USD pair has been trading downwards. The price tested the level of 0.7234. Anyway, according to the H1 time – frame, I found breakout of the supply trendline in the background and potential bullish flag in creation, which is a sign that selling looks risky. My advice is to watch for buying opportunities if you see a breakout of the bullish flag. The upward target is set at the price of 0.7336.


No comments:
Post a Comment