Analysis of Gold for November 23, 2018
2018-11-23
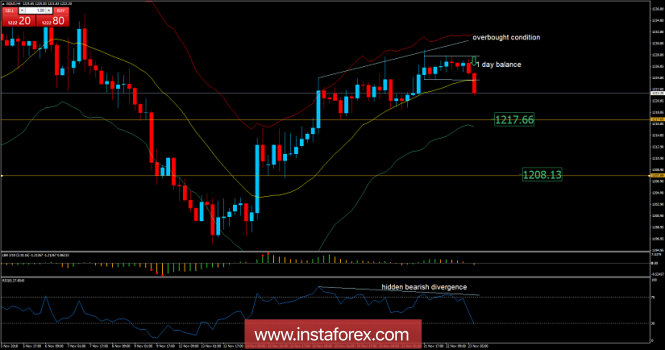
Recently, Gold has been trading sideways at the price of $1,224.00. Anyway, according to the H4 time – frame, I have found a bearish breakout of the 24-hour balance, which is a sign that sellers are in control. I also found the rejection of the upper Keltner band and hidden bearish divergence on the RSI oscillator, which is another sign of weakness. My advice is to watch for selling opportunities. The downward targets are set at the price of $1,217.60 and at the price of $1,208.13.
EUR/USD analysis for November 23, 2018
2018-11-23
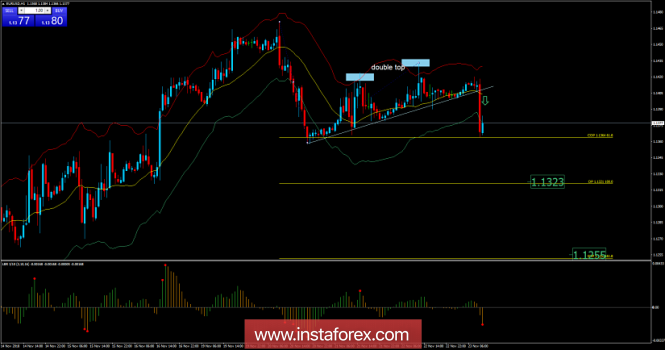
Recently, the EUR/USD pair has been trading downwards. The price tested the level of 1.1364. According to the H1 time – frame, I have found the breakout of the upward trendline and a double top formation in the background, which is a ign that sellers are in control. The price also rejected from the upper Keltner band (resistance), which is another sign of weakness. My advice is to watch for selling opportunities. The downward targets are set at the price of 1.1323 and at the price of 1.1255.
Technical analysis of USD/CAD for November 23, 2018
2018-11-23
Overview:
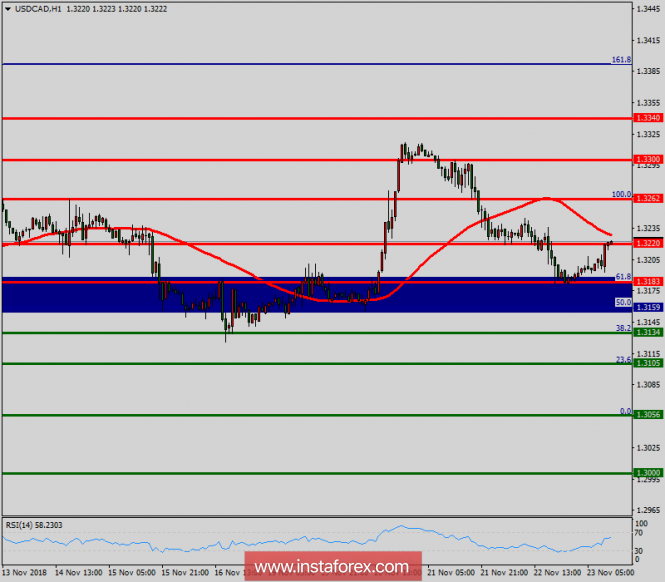
Pivot: 1.3159.
The USD/CAD pair continues to move upwards from the level of 1.3134. The pair rose from the level of 1.3134 (the level of 1.3134 coincides with a ratio of 38.2% Fibonacci retracement) to a top around 1.3160. Today, the first support level is seen at 1.3134 followed by 1.3105, while daily resistance 1 is seen at 1.3183. According to the previous events, the USD/CAD pair is still moving between the levels of 1.3134 and 1.3262; for that we expect a range of 128 pips (1.3262 - 1.3134). On the one-hour chart, immediate resistance is seen at 1.3183, which coincides with a ratio of 61.8% Fibonacci retracement. Currently, the price is moving in a bullish channel. This is confirmed by the RSI indicator signaling that we are still in a bullish trending market. The price is still above the moving average (100), Therefore, if the trend is able to break out through the first resistance level of 1.3183, we should see the pair climbing towards the daily resistance at 1.3262 to test the double top on the H1 chart. It would also be wise to consider where to place stop loss; this should be set below the second support of 1.3105.
Technical analysis of GBP/USD for November 23, 2018
2018-11-23
Overview:
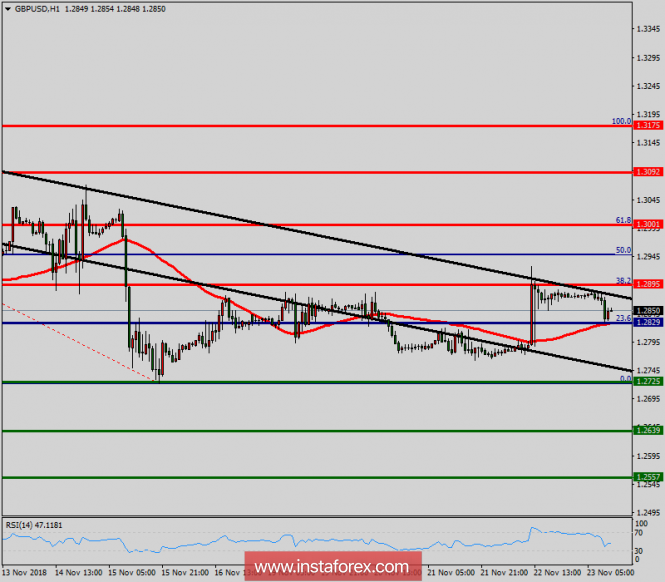
The GBP/USD pair dropped sharply from the level of 1.2890 towards 1.2780. Now, the price is set at 1.2850.
On the H1 chart, the resistance is seen at the levels of 1.2890 and 1.3001. Volatility is very high for that the GBP/USD pair is still expected to be moving between 1.2829 and 1.2725 in coming hours. In the short term, we expect the GBP/USD pair to continue to trade in a bullish trend from the new support level of 1.2725 to form a bullish channel. Also, it should be noted that major resistance is seen at 1.2829, while immediate resistance is found at 1.2829.
According to the previous events, the pair is likely to move from 1.2725 towards 1.2829 and 1.2890 as targets.
In the H4 time frame: However, if the pair fails to pass through the level of 1.2890, the market will indicate a bearish opportunity below the level of 1.2890. So, the market will decline further to 1.2725 in order to return to the daily support.
Moreover, a breakout of that target will move the pair further downwards to 1.2639.
Intraday technical levels and trading recommendations for EUR/USD for November 23, 2018
2018-11-23
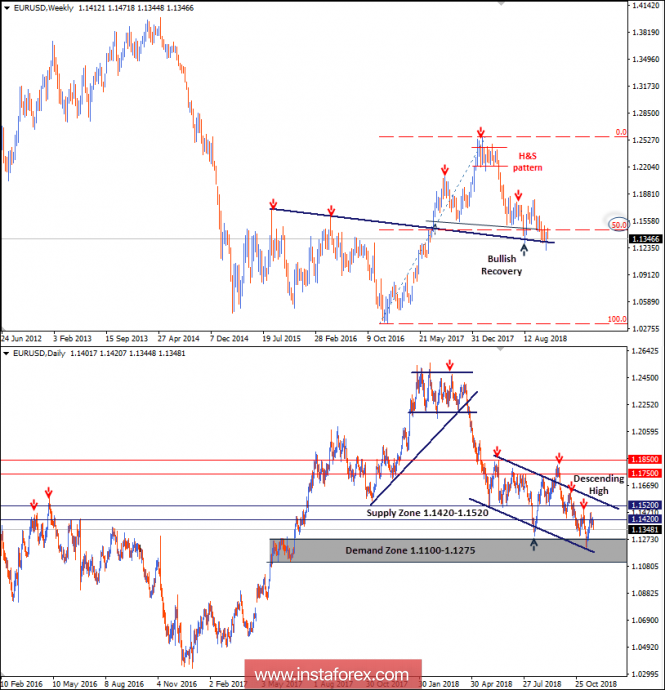
On the weekly chart, the EUR/USD pair is demonstrating a high-probability Head and Shoulders reversal pattern where the right shoulder is currently in progress.
On the Daily chart, the pair has been moving sideways with slight bearish tendency. Recent bearish movement is maintained within the depicted daily movement channel.
On November 13, the EUR/USD demonstrated recent bullish recovery around 1.1220-1.1250 where the lower limit of the channel as well as the depicted demand zone came to meet the pair.
Quick bullish advancement was demonstrated towards 1.1420. To be noted that prominent supply zone as well as the previous wave high are located around 1.1420-1.1520.
Bullish fixation above 1.1420 enhances further bullish movement towards 1.1520 and probably 1.1600 where the upper limit of the daily channel comes to meet the EUR/USD pair.
Otherwise, the EUR/USD pair remains trapped below 1.1400 within a narrow price range (1.1275-1.1400) until breakout occurs in either directions.
Intraday technical levels and trading recommendations for GBP/USD for November 23, 2018
2018-11-23
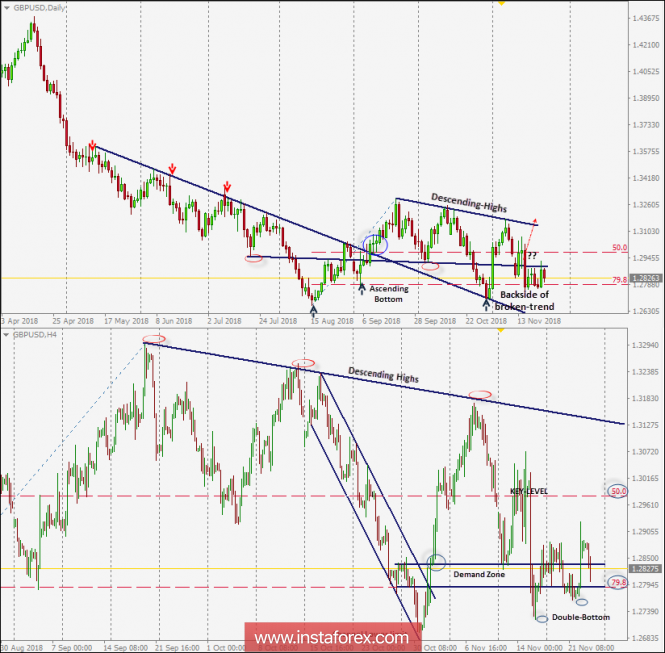
On September 21, the GBP/USD failed to demonstrate sufficient bullish momentum above 1.3296. The short-term outlook turned to become bearish to test the backside of the broken uptrend.
On H4 chart, the GBP/USD pair looked oversold around the price levels of 1.2700 where profitable BUY entries were suggested.
A quick bullish movement was demonstrated towards the price level of 1.3170-1.3200 where the depicted downtrend came to meet the GBP/USD pair.
This initiated the current bearish pullback towards the depicted demand-zone of (1.2850-1.2780) where slight bullish recovery towards 1.2980 (key-level) was overpowered by quick bearish decline towards 1.2720 on November 15.
Recently, the GBP/USD pair failed to establish a successful bullish breakout above the price level of 1.2980 (key-level for the short-term scenario). Moreover, a quick bearish decline was demonstrated towards the price zone around 1.2780.
Early signs of bullish recovery are manifested on the H4 chart. A double-bottom reversal pattern is about to be confirmed.
Bullish persistence above the price zone of 1.2870 (neckline of the reversal pattern) is needed to allow another bullish movement to occur towards 1.2980 and probably 1.3100 where the depicted daily downtrend comes to meet the pair.
On the other hand, bearish decline below 1.2780 invalidates the bullish scenario allowing further bearish decline towards 1.2700 and 1.2670.


No comments:
Post a Comment