The Wealth Effect
Harry Dent | September 26, 2019 | I predicted in 1988 forward that the massive Baby Boom generation would peak in its spending by late 2007. Simply that 46-year lag for peak spending of the average household. That happened on cue and we've been living off of accelerating QE and now tax cuts ever since to compensate. So, with such a natural decline in spending, how has the economy even grown as slow as it has (2%)? Two things. First the upper class of about 20% of college educated professionals does not peak until age 57. 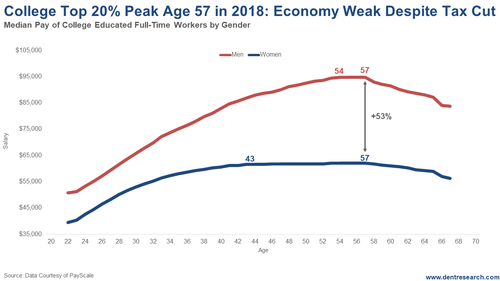
In 2007, the average household peaked and now that's happening with the elite ones. Who do you stimulate to spend now? Then you could say, "Well, that's only 20%." The secret is that they control about 50% of the spending due to their higher incomes. I covered on Monday how the median income of the top 19% upper class is a whopping $187,872, 2.4 times the 52% middle class and 7.3 times the 29% lower class. They would have kept their half going through 2018 – and guess what? We are already slowing back to 2% and likely lower even after the big tax cuts in 2018. These people are most likely the main culprit. But second, and perhaps most important: This upper class that own 87% of the financial assets in the U.S. have been even more highly leveraged by the "wealth effect." When people's wealth and financial assets rise, they feel more able to spend, especially on big ticket items like cars and houses. Oh, and artificially lower interest rates from QE also lower the cost of financing those. Example: Since QE, auto sales now peak at age 64 (when net worth peaks) instead of 50-54, historically. Look at the bubble in financial assets outside of financial corporations, largely households and businesses. 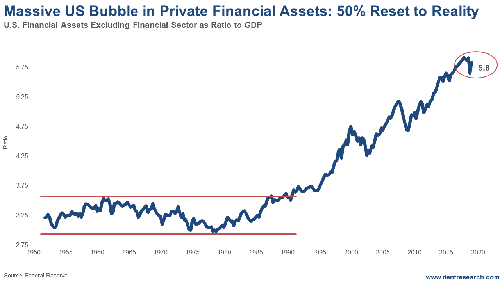
From 1950 through 1990, the ratio of financial assets to GDP stayed in a narrow range between 2.95 and 3.65 times. The highest was around the top of stocks between 1965 and 1972 before the crash of 1973-74 that brought financial assets down to the bottom of that range. But since the early 1990s, this ratio has ballooned. It peaked at 5.9 times in 2017 and is presently at 5.8. Now for the numbers: a whopping $123.2 trillion. What's obvious to me after the greatest bubble in modern history is that this ratio back down to the low end of that more normal historical range and then trade within that range largely or wholly again for decades to come. This means that about 53% of financial assets, or $65 trillion, will disappear from our economy within about 3 years and mostly not return for a long time, if ever. $89 trillion of those financial assets are households alone… And then there is the $84 trillion in higher leveraged financial assets in the financial sector. This doesn't crimp spending as much as it contributes more to the bubble collapse. How much Fed printing would it take to offset this avalanche? $20 trillion, or ultimately $65 trillion? Think they can get away with that after printing an unprecedented $4 trillion that was not enough? 
Harry Dent Trending Stories... In our 5 Day Forecast last Monday for Boom & Bust subscribers, I highlighted two scenarios – one for stocks and one for Bitcoin – that looked imminent to break up or down sharply. Well on Tuesday, Bitcoin made its break down out of a large triangle pattern that was coming to a make or... I bet you thought I was going to stomp into the minefield of gender politics with that headline, but I'm not! While I have definite views on the differences between the sexes, having raised both a son and daughters, in this instance I'm referring to something completely different… storms. Tropical Storm Imelda Wasn't Like Hurricane... Pew Research is my favorite mainstream firm, and it has just come out with results about the status of the upper, middle, and lower class in America. As you would guess, the upper class has gained ground since 1971 while the middle and lower have lost… But not as much as the top 1% and... The big news this week was that the Fed cut rates by around 25%. This was to be expected, though it's still a relatively big deal, and is something to take notice of with regard to a liquidity crisis on the way. On Monday the overnight borrowing rate for banks shot up to 10% (it's... The title of this piece is a play on a book, but the question stands: Will cowboys, or anyone else who buys a truck, be interested in an electric version? Ford and GM are betting their companies on it, which could be a huge mistake. A Truck-Loving Family Somewhere along the way, we became a... | 


No comments:
Post a Comment