Major Bitcoin Break Down Suggests the Same for Stocks
Harry Dent | September 25, 2019 | In our 5 Day Forecast last Monday for Boom & Bust subscribers, I highlighted two scenarios – one for stocks and one for Bitcoin – that looked imminent to break up or down sharply. Well on Tuesday Bitcoin made its break down out of a large triangle pattern that was coming to a make or break point. This is worse as the more typical pattern would be to break out in the same direction it came into the triangle, i.e., up. 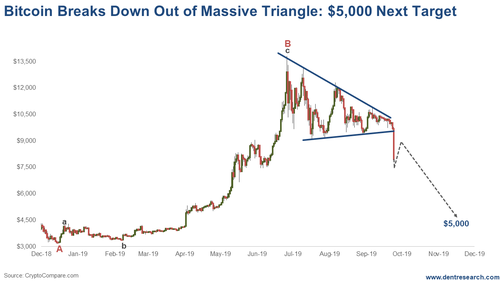
This was no shabby break. Bitcoin was down over $1,500, $1,000 of that in 30 minutes as it first broke key resistance at $9,400. The next move is often as large as the widest part of the triangle, which would be about $4,400, or about a $5,000 target from that break-out point at the bottom trend line. Why is this important? I have been using Bitcoin as the final, steep bubble in this second broader tech bubble, as the young and super-overvalued internet stocks were in the last tech bubble. This key break after an already too-long correction in my $32,000 final bubble projection strongly invalidates that option and makes this likely a B-wave or bear market rally top back at $13,827 in late June. The ultimate low before a 17-year or so bull market like the internet stocks would be at a minimum the $3,170 low last December. I would project more back to the bubble origin in late April 2017 around $1,250 - $1,300. No run to $32,000 on Bitcoin, no final blast to 10,000 on the Nasdaq – by my best calculations! So, that leaves my second scenario with a completed megaphone pattern for the Dow and S&P 500 – and a likely final top for them. In last week's 5 Day Forecast I also showed the chart of the Dow's mini megaphone pattern that was due to be tested soon – and the markets were not able to push even to slight new highs to complete that pattern. 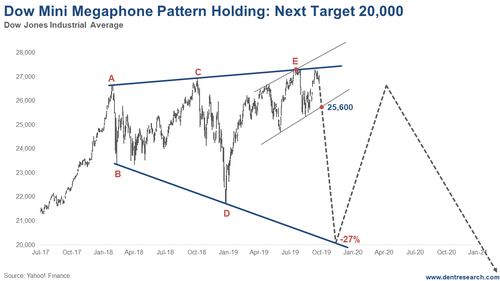
The megaphone pattern is simply one of higher highs followed by lower lows, until you get that third high which now looks like it was back in July at 27,399. This one completes a larger megaphone pattern with peaks in 2000, 2007 and now. The lowest next target would be at that bottom trend line of lower lows at around 20,000. That's a 27% drop and larger than the September to December crash in late 2018. But in this scenario, there was always a final run at a new high that fails. Trump has been begging for stronger rate cuts and a resumption of QE. Powell has resisted looking like a lapdog. But a stock crash of this magnitude and more signs of weakening, like continued falling Treasury bond yields and rising gold prices would give the Fed ample excuse to turn back on the heat big time! What does a "market on crack" most want? More crack! Here's the subtlety that most analysts will not catch if this scenario plays out: The Nasdaq is also in a mini megaphone that is a little broader that just put in the third or C wave top. A crash to around 5,700 would set it up to make a slight new high around 8,500+ on this final all-out stimulus rally while the Dow and S&P fail to make new highs… That would be a classic divergence and sign of a major top. A break of the light bottom line of the recent channel line-up at around 25,600 would further confirm this scenario and a deeper, but not final crash. The best target for the sharp wave down would be around early to mid-November. The final top of the Nasdaq could correspond with Andy Pancholi's strongest turn point in late April/early May at The Market Timing Report. This is a good time to lighten up or sell stocks. A break to new highs in the Nasdaq by early May next year would be the final signal. Put options to hedge would be another good strategy here, and again if we see that final rally at slight new highs for the Nasdaq next year. 
Harry Dent Trending Stories... I bet you thought I was going to stomp into the minefield of gender politics with that headline, but I'm not! While I have definite views on the differences between the sexes, having raised both a son and daughters, in this instance I'm referring to something completely different… storms. Tropical Storm Imelda Wasn't Like Hurricane... Pew Research is my favorite mainstream firm, and it has just come out with results about the status of the upper, middle, and lower class in America. As you would guess, the upper class has gained ground since 1971 while the middle and lower have lost… But not as much as the top 1% and... The big news this week was that the Fed cut rates by around 25%. This was to be expected, though it's still a relatively big deal, and is something to take notice of with regard to a liquidity crisis on the way. On Monday the overnight borrowing rate for banks shot up to 10% (it's... The title of this piece is a play on a book, but the question stands: Will cowboys, or anyone else who buys a truck, be interested in an electric version? Ford and GM are betting their companies on it, which could be a huge mistake. A Truck-Loving Family Somewhere along the way, we became a... Today we wrap up our trio of Irrational Economic Summit preview interviews with Dent Research Senior Research Analyst Dave Okenquist. We began with Dr. Lacy Hunt and continued Monday with U.S.-China expert Gordon Chang. This final installment features a conversation between Dave and IES's keynote speaker, David Stockman. David is the former congressman, author of... | 


No comments:
Post a Comment