FWD: How Far Will Markets Correct?

Two scenarios for the Dark Window finale‌ ‌ ‌ ‌ ‌ ‌ ‌ ‌ ‌ ‌ ‌ ‌ ‌ ‌ ‌ ‌ ‌ ‌ ‌ ‌ ‌ ‌ ‌ ‌ ‌ ‌ ‌ ‌ ‌ ‌ ‌ ‌ ‌ ‌ ‌ ‌ ‌ ‌ ‌ ‌ ‌ ‌ ‌ ‌ ‌ ‌ ‌ ‌ ‌ ‌ ‌ ‌ ‌ ‌ ‌ ‌ ‌ ‌ ‌ ‌ ‌ ‌ ‌ ‌ ‌ ‌ ‌ ‌ ‌ ‌ ‌ ‌ ‌ ‌ ‌ ‌ ‌ ‌ ‌ ‌ ‌ ‌ ‌ ‌ ‌ ‌ ‌ ‌ ‌ ‌ ‌ ‌ ‌ ‌ ‌ ‌ ‌ ‌ ‌ ‌ ‌ ‌ ‌ ‌ ‌ ‌ ‌ ‌ ‌ ‌ ‌ ‌ ‌ ‌ ‌ ‌ ‌ ‌ ‌ ‌ ‌ ‌ ‌ ‌ ‌ ‌ ‌ ‌ ‌ ‌ ‌ ‌ ‌ ‌ ‌ ‌ ‌ ‌ ‌ ‌ ‌ ‌ ‌ ‌ 
‌ ‌ ‌ ‌ ‌ ‌ ‌ ‌ ‌ ‌ ‌ ‌ ‌ ‌ ‌ ‌ ‌ ‌ ‌ ‌ ‌ ‌ ‌ ‌ ‌ ‌ ‌ ‌ ‌ ‌ ‌ ‌ ‌ ‌ ‌ ‌ ‌ ‌ ‌ ‌ ‌ ‌ ‌ ‌ ‌ ‌ ‌ ‌ ‌ ‌ ‌ ‌ ‌ ‌


Hey!

U.S. Markets endured a brutal day yesterday. This morning, they opened in the green and stayed pretty steady most of the day. So, this is a good time to give you an update on what I expect markets will do next.

Yesterday, I emailed my Boom & Bust subscribers with details of the two scenarios currently on the cards for the Dark Window finale. Because this is a critical time in the markets, I'm forwarding you that message today via your regular Economy & Markets email.

Please read the FWD below to hear what is likely to happen next.

Harry Dent's signature

Harry
Founder, Dent Research

From: Harry Dent
Sent: Monday, May 13, 2019 1:25 PM
To: 5 Day Forecast
Subject: How Far Will Markets Correct?


Please consider allowing your email client to download images associated with this email.


facebook rss feed youtube youtube

5 DAY FORECAST>> May 13, 2019
Website: www.dentresearch.com/
Forgot your login information? Click here.

How Far Will Markets Correct?
Two Scenarios for the Dark Window Finale

By Harry Dent

In my Economy & Markets video on Friday, I discussed why the trade deal has been challenging and likely doomed in the end. I also talked about the impact the "sudden" collapse in negotiations has had on the markets. Investors thought a deal was imminent. Now, they see it's nowhere in sight… and they're storming the exits.

Regardless of the reason, a correction was overdue… and I'm glad it's finally taking place because it sets up the Dark Window finale perfectly.

As always, I have two scenarios for what comes next…

[CLICK TO ENLARGE]

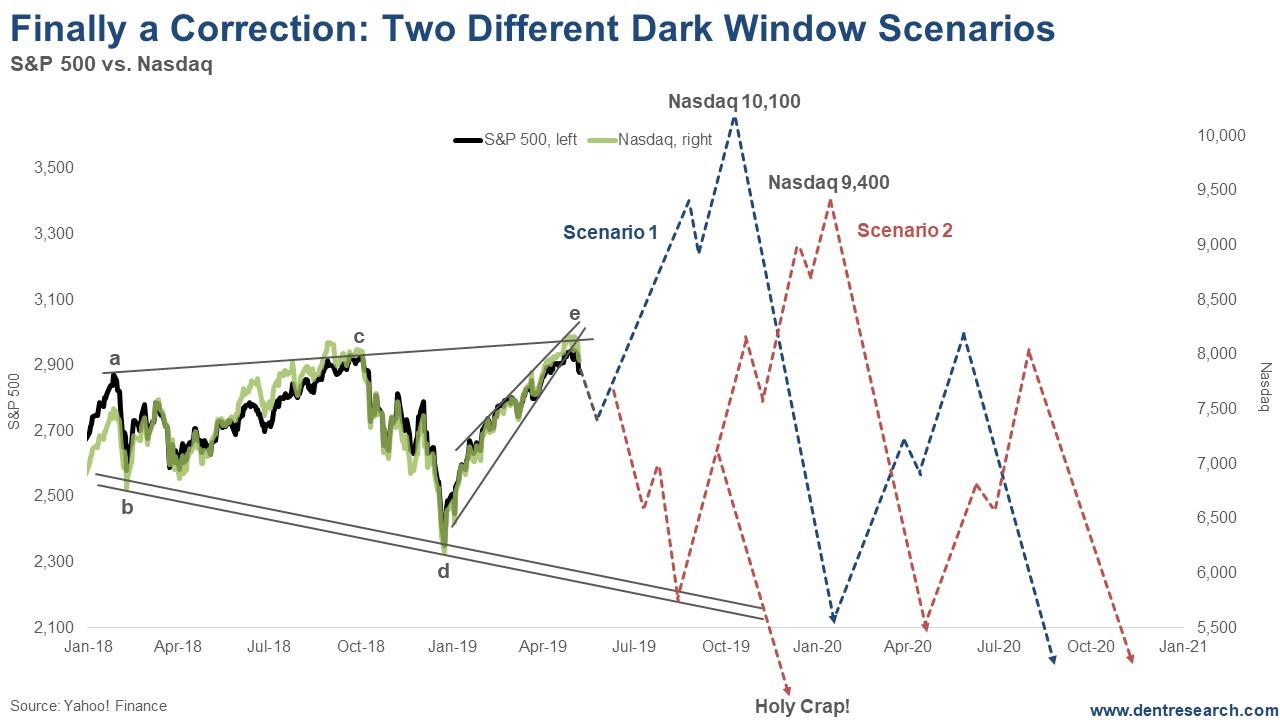
This chart may look a little complex because I'm including a number of charting concepts, but just focus on the simplicity of the two scenarios in the blue and red projections.

Note that I focus most on the Nasdaq because it's the lead bubble.

Scenario #1: Meh…

The first scenario sees a shallower correction, not much lower than around 7,350 (down 10%) on the Nasdaq and 2,710 (down 8% or so) on the S&P 500… within about a month.

After that, it's a rocket shot to the moon by as early as September. I'm talking 10,100 Nasdaq target and as high as 3,500 for the S&P 500. However, the broader indices may lag like they did into early 2000.

Scenario #2: Much Scarier

The second scenario tests and likely makes slight new lows into around late July or early August.

Then, it turns around and shoots to around 9,400 on the Nasdaq by early January 2020 or so.

Where did I get those 10,100 and 9,400 targets?

From the exponential progression I have shown in past articles, but starting from different lows. My exponential long-term trendline through the tops comes through around 9,400 later this year… and it would be typical to see an "overthrow" rally to something like that 10,100 target.

But look back at the chart and consider the green and black lines to the left. As you can see, the S&P 500 has formed a near-perfect megaphone pattern with higher highs and lower lows. It has completed (or near if there is one more quick bounce) an e-wave final top. This puts the correction target at the trend-line through the lower lows. That projects an S&P 500 of around 2,200 in three months or so.

This is important because it would potentially break the broader trend-line through the bottoms since 2009 at around 2,350, where the S&P 500 bottomed in December. As I've said many times, that's a "line in the sand" for the index. Maybe it holds near 2,350. That would be optimal for the Dark Window scenario.

The bottom megaphone trend-line would suggest a bottom for the Nasdaq around 5,500 to 6,000. The lower number is its line in the sand through longer-term bottoms.

Note the "Holy Crap" marker…

If we break both of those lines clearly, then this bubble is very likely over. However, this is not a likely scenario at this point because the triple-top between January 2018 and April 2019 doesn't look like a classic major bubble top.

I knew in November that the previous September 2018 peak wasn't a top because it wasn't acting like first crashes of past bubbles, where the trend was for losses of 42% on average in the first 2.6 months.

Also note the e-wave up to the recent top…

It was a classic rising wedge on the leading Nasdaq – and more so on the Nasdaq 100 (NDX) that marks near -erm tops. We have broken down out of that wedge and that increases the odds of a more significant correction near term. In other words, scenario 2.

If scenarios 2 is developing, and we see new lows over the next month, it should last three months and look more like the crash on September to December 2018. The first wave of that crash in the first month saw losses of 15% on the Nasdaq and 11% on the S&P 500.

That's why its important how much the market goes down in these next several weeks, into say early June. If the markets are down 8% to 10%, we're more likely in scenario 1. If they lose 11% to 15%, we're likely to be in scenario 2.

This Dark Window move will surprise almost everyone and be very tricky. That's why its important to keep monitoring it…

I'll keep you updated.
Harry Dent's signature

Harry Dent
Follow me on Twitter @harrydentjr

For information about your membership, contact Member Services at:

Charles Street Publishing
Phone: 888-211-2215
Fax: 410-223-2682
Web: http://www.dentresearch.com/contact-us/
Address: 819 North Charles Street, Baltimore MD, 21201.

LEGAL NOTICE
Protected by copyright laws of the United States and international treaties. This newsletter may only be used pursuant to the subscription agreement and any reproduction, copying, or redistribution (electronic or otherwise, including on the worldwide web), in whole or in part, is strictly prohibited without the express written permission of Charles Street Publishing.

This work is based on SEC filings, current events, interviews, corporate press releases and what we've learned as financial journalists. It may contain errors and you shouldn't make any investment decision based solely on what you read here. It's your money and your responsibility. The information herein is not intended to be personal legal or investment recommendations and may not be appropriate or applicable for all readers. If personal advice is needed, the services of a qualified legal, investment or tax professional should be sought. We expressly forbid our writers from having a financial interest in any security recommended to our readers. All of our employees and agents must wait 24 hours after on-line publication or 72 hours after the mailing of printed-only publication prior to following an initial recommendation.

Please note: We sent this e-mail to PHANPHUONGTHANH89.822152@blogger.com because you subscribed to this service.


Trending Stories...

Uber et al: Unicorns Leading the Way to the Great Crash Ahead

Markets were badly shaken this morning as news of China's planned tariffs on $60 billion worth of U.S. goods hit the wire. I emailed Boom & Bust subscribers earlier with an update on my Dark Window scenario, and some insights into what to expect over the next few months. I've labelled one possible outcome "Holy...

The U.S. China Trade Deal Fantasy and the Markets

Markets look to finally be making a much-needed correction, triggered by the U.S.-China trade deal drama. Everyone seems to think a deal is around the corner. Not me. While this trade war hurts them, they have a long-term goal, and they're prepare to take all the pain in the world to achieve it. I explain...

Crunching the numbers on today's inflation

I recently had dinner with my extended family. Afterwards, my parents mentioned they were surprised at how expensive the meal had been. It was a nice restaurant, but nothing fancy. It worked out to roughly $50 apiece, before tip. As we left, we separately climbed into our newish cars, which all cost more than $40,000....

The Dangers Beyond the China-U.S. Trade War

U.S. markets have had a bad week. After reaching all-time highs recently – the Dow at 26,656.39 on April 23 (not quite new high), the S&P 500 at 2,945.83 on April 30, and the Nasdaq at 8,164 on May 3 – they've spent the last three days in the red. Monday, the Dow shed as...

Where Growth Is Free and Everybody Gets Rich

Employment numbers came out last week and showed unemployment at a 50-year low. Average hourly earnings are up 3.2% over the past year. Add in the equity markets at record highs, GDP at 3.2% in the first quarter, and 10-year bonds at 2.5%, and you might be forgiven for thinking we're in economic growth nirvana. But...

No comments:

Post a Comment