The Repo Crisis
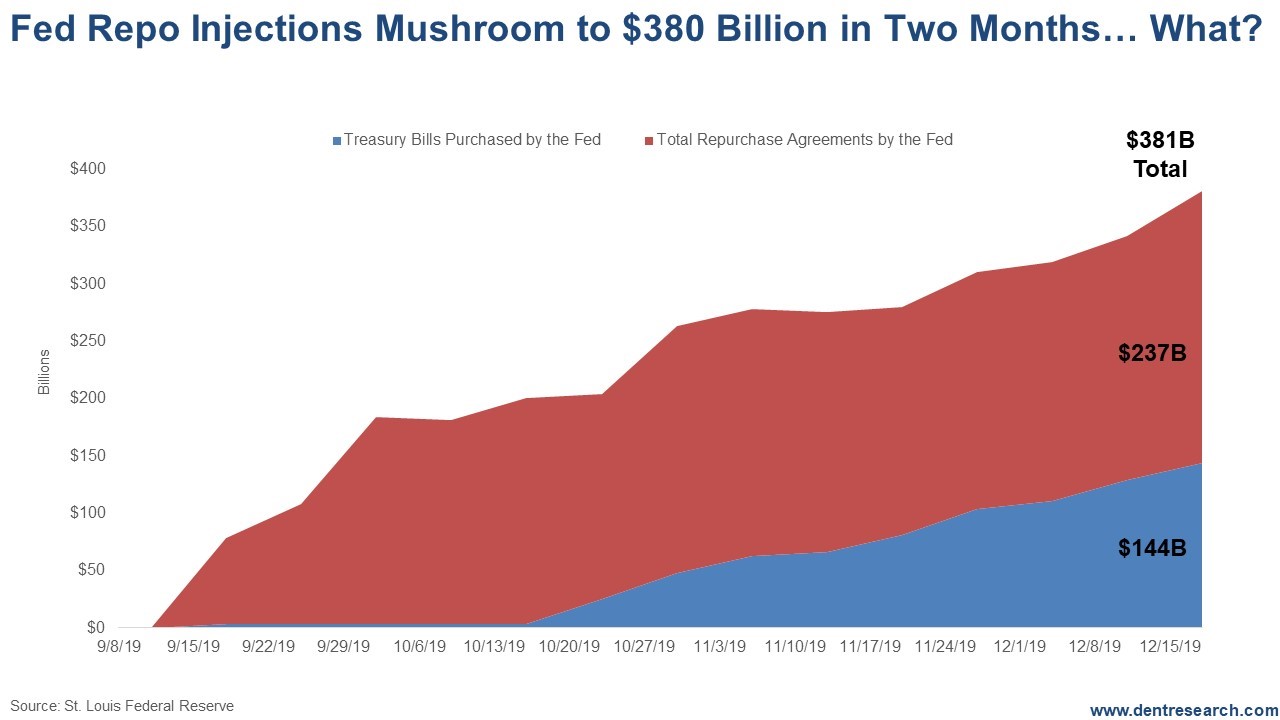
No One's Talking About | I knew this repo crisis would require more injections, but it wasn't easy to get clear data on just how many it would take. I was trying to identify how much money has gone into propping up the repo or overnight bank lending market since its sudden spike in rates to 10% signaled a crisis in liquidity. It's like no one on Wall Street wants to talk about this… Hmmm…. Rodney Johnson finally found a credible article. Remember that $60 billion initial injection in mid-September that came to calm that spike in rates? Well, it mushroomed to $380B (billion) as of mid-December. No wonder Wall Street is not talking about this… It's obviously not a small, temporary crisis! This is a big, red flag. At the peak of quantitative easing, $60B a month was being injected into the financial markets. This is the equivalent of $190B a month! In mid-September, the large banks suddenly decided that they would rather keep their reserves with the Fed at 1.55% than lend at slightly higher rates to smaller banks, and leveraged investors that have to borrow overnight to cover their shortfalls. There are two reasons for this, from what I can see. First, the Fed finally tapered a bit and sold of some of their bond stash which took reserves and liquidity out of the system, so less excess to lend. Second, these larger banks are starting to smell more risk in this normally risk-free overnight market. Some of these loans are to gunslinging, leveraged hedge funds. Here's the chart that tells the real story. 
[Click to Enlarge] The largest chunk of the $380B through mid-December is the Fed purchasing repo agreements directly or lending against them to bail-out the lenders and borrowers overnight. That's $237B. The other $144B is the Fed buying T-bills. They are doing that to make it look like something other than QE, which tends to buy longer-term bonds to push down longer-term rates that they can't control as easily as they do by simply setting short-term rates through the Fed funds rate. They buy bonds artificially with funny money and push rates down. Whistleblowing Economist Finally Breaks Silence Discover the shocking evidence economist Harry Dent is revealing today, detailing the hidden secrets behind what he believes could vaporize your retirement accounts. Find out how to protect your nest egg from what he's calling a "secret attack on Americans." Click here for more details But that misses the bigger point. These injections are coming from money printed out of thin air, and they are injected into the financial asset markets, not into bank lending or money supply. Just like QE, there is more money chasing the same bonds, stocks, real estate assets, etc., which pushes up the prices of everything. This whole bubble since 2009 has been about injecting more money into the financial asset pool – and investors, especially those Wall Street gunslingers, trading up into higher risk given a market that is literally insured not to go down due to constant new money flowing in and strong reactions with injections when stocks or the economy do stumble… And this is a big stumble here! This, along with cheap stock buybacks that leverage companies' own stocks, explains why stocks are overvalued 120% from where they would be on my Spending Wave model that has tracked so closely for decades (see January's Boom & Bust ). Stocks are at record highs and we are seeing the greatest and most global financial asset bubble ever when real growth in the recovery since 2009 has been the worst ever. The economy does not have the fundamental trends to grow at 4%+ a year again, until bad debts, banks and companies are purged and demographic trends turn back up from 2023 forward. So, it's stocks and financial assets that have to come down to reality – big time. But what's happening since September when repo QE started – without any significant good news for the markets after trending more sideways since January 2018? They just keep melting up with the help of a largely undisclosed $380 billion. Most fundamentally: This is an under the radar way for the Fed to reverse its tapering policies that proved again that the broken over-leveraged economy and banking system cannot survive without endless QE… more crack! The Fed balance sheet is now nearing its peak in late 2014 and will soon exceed it again. I'm still looking for Nasdaq 10,000 by early 2020 in a final blow-off rally unless we get a big surprise correction near term – and one more surge after that, which would last later into 2020. But this is another sign that it just gets harder to keep stretching that rubber band to such extremes without it snapping back! This "little repo crisis" is a big snapback with more to come. link to Jan BNB for PAID and NET… and link BNB OF for FREE 
Harry Dent This Week in Economy & Markets...  I knew this repo crisis would require more injections, but it wasn't easy to get clear data on just how many it would take. I was trying to identify how much money has gone into propping up the repo or overnight bank lending market since its sudden spike in rates to 10% signaled a crisis in liquidity.... I knew this repo crisis would require more injections, but it wasn't easy to get clear data on just how many it would take. I was trying to identify how much money has gone into propping up the repo or overnight bank lending market since its sudden spike in rates to 10% signaled a crisis in liquidity....
 The central banks' job of keeping this big, fat ugly bubble going is just going to get harder. Not only are they fighting record debt and falling demographic trends in the developed world – with my hierarchy of indicators all pointing down – they are fighting record debt in the emerging world and slowing growth there near-term, despite favorable longer-term demographic trends.... The central banks' job of keeping this big, fat ugly bubble going is just going to get harder. Not only are they fighting record debt and falling demographic trends in the developed world – with my hierarchy of indicators all pointing down – they are fighting record debt in the emerging world and slowing growth there near-term, despite favorable longer-term demographic trends....
 I haven't worked in a traditional office in a long time. I miss some of the camaraderie, the ability to bounce ideas around, and the occasional happy hour. But I don't miss some of the personnel issues that pop up, like friction among co-workers, bad-smelling lunches wafting through the office, and the annual Secret Santa.... I haven't worked in a traditional office in a long time. I miss some of the camaraderie, the ability to bounce ideas around, and the occasional happy hour. But I don't miss some of the personnel issues that pop up, like friction among co-workers, bad-smelling lunches wafting through the office, and the annual Secret Santa....
 I always remind people and economists that Japan was the first Asian Tiger – the first to urbanize rapidly on an S-Curve to $40,000+ GDP per capita PPP and DC (developing country) status in just under 30 years. When I speak in South Korea, I tell them: You are Japan on a 22-year lag for the peaks in your Baby Boom generations and near full urbanization. And they have done the same.... I always remind people and economists that Japan was the first Asian Tiger – the first to urbanize rapidly on an S-Curve to $40,000+ GDP per capita PPP and DC (developing country) status in just under 30 years. When I speak in South Korea, I tell them: You are Japan on a 22-year lag for the peaks in your Baby Boom generations and near full urbanization. And they have done the same....
|
No comments:
Post a Comment