| EUR/USD analysis for December 05, 2018 2018-12-05 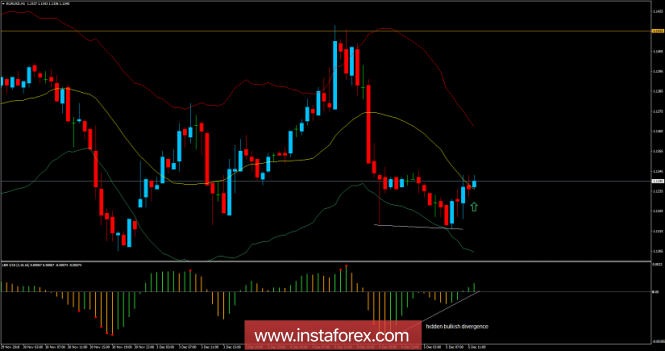
Recently, the EUR/USD pair has been trading downwards. The price tested the level of 1.1318. Anyway, according to the H1 time – frame, I found rejection of the yesterday's low at the price of 1.1318, which is a sign that sellers don't have power for further downward continuation. I also found a hidden bullish divergence on the LBR oscillator, which is another sign of the strength. My advice is to watch for buying opportunities. The upward target is set at the price of 1.1415. GBP/USD analysis for December 05, 2018 2018-12-05 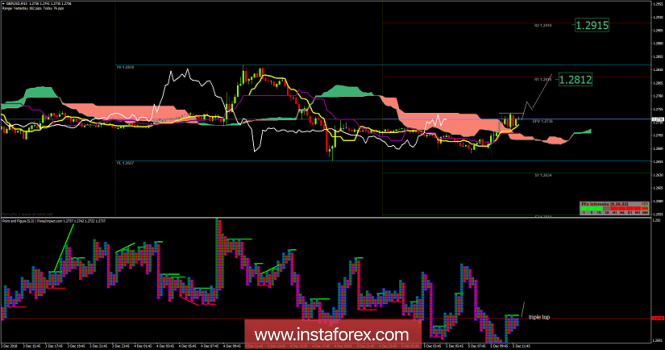
Recently, the GBP/USD pair has been trading sideways at the price of 1.2736. According to the M15 time – frame, I found out that price is trading above the Ichimoku cloud and above Kijun- sen and Tenkan-sen, which is a sign that buyers are in control. I also found on the point and figure chart that there is a triple top formation created, which is another sign of strength. My advice is to watch for buying opportunities above the 1.2750. The upward targets are set at the price of 1.2812 (pivot R1) and at the price of 1.2915 (Pivot R2). Technical analysis of AUD/USD for December 05, 2018 2018-12-05 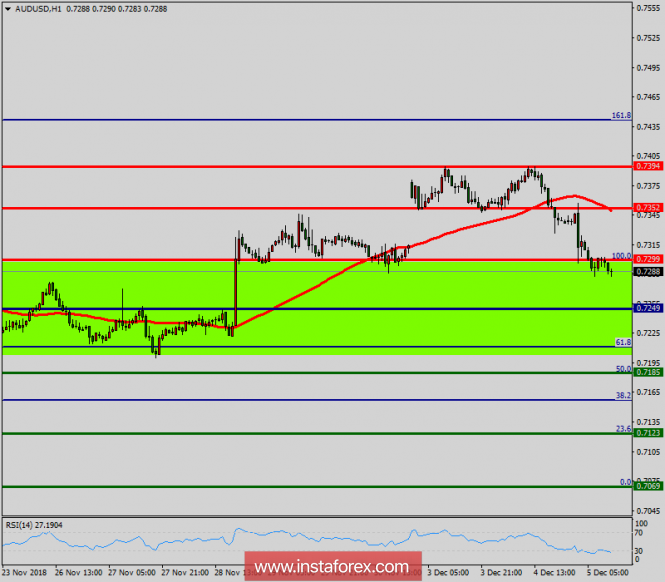 Overview: The AUD/USD pair continue to trade upwards from the level of 0.7249. The pair rose from the level of 0.7249 to a top around 0.7299 but it rebounded to set around the spot of 0.7249. Today, the first resistance level is seen at 0.7299 followed by 0.7352, while daily support 1 is seen at 0.7185 (50% Fibonacci retracement). According to the previous events, the AUD/USD pair is still moving between the levels of 0.7250 and 0.7352; so we expect a range of 102 pips. Furthermore, if the trend is able to break out through the first resistance level at 0.7299, we should see the pair climbing towards the double top (0.7299) to test it. Therefore, buy above the level of 0.7299 with the first target at 0.7352 in order to test the daily resistance 1 and further to 0.7394. Also, it might be noted that the level of 0.7394 is a good place to take profit because it will form a double top. On the other hand, in case a reversal takes place and the AUD/USD pair breaks through the support level of 0.7185, a further decline to 0.7069 can occur which would indicate a bearish market. Technical analysis of NZD/USD for December 05, 2018 2018-12-05 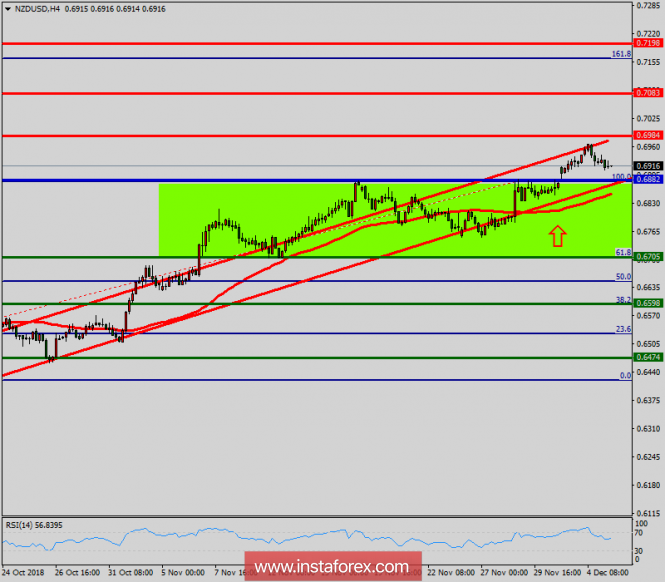 Overview: In the long term, the NZD/USD pair broke resistance which turned to strong support at the level of 0.6705 this week. The level of 0.6705 coincides with a golden ratio (61.8% of Fibonacci), which is expected to act as major support today. The Relative Strength Index (RSI) is considered overbought because it is above 70. The RSI is still signaling that the trend is upward as it is still strong above the moving average (100). This suggests the pair will probably go up in coming hours. Accordingly, the market is likely to show signs of a bullish trend. In other words, buy orders are recommended above 0.6800 with the first target at the level of 0.6882. From this point, the pair is likely to begin an ascending movement to the point of 0.6882 and further to the level of 0.6984. The level of 0.6984 will act as strong resistance. On the other hand, if a breakout happens at the support level of 0.6705, then this scenario may become invalidated. Intraday technical levels and trading recommendations for EUR/USD for December 5, 2018 2018-12-05 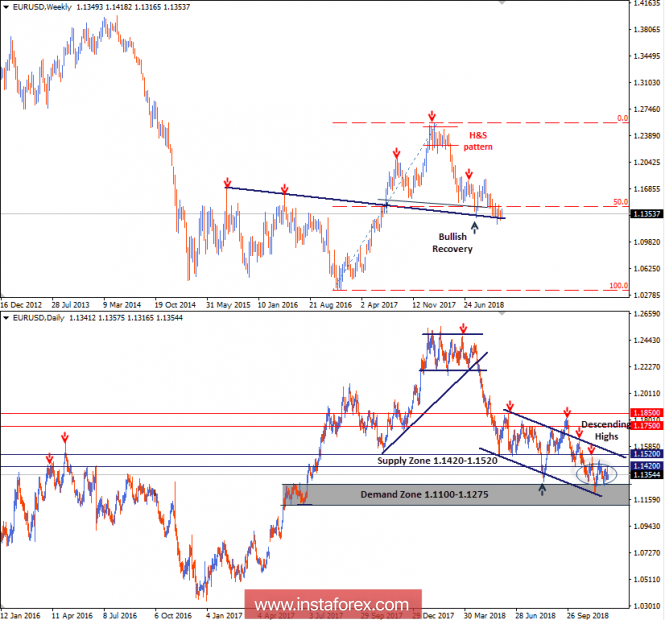
On the weekly chart, the EUR/USD pair is demonstrating a high-probability Head and Shoulders reversal pattern where the right shoulder is currently in progress. On the Daily chart, the pair has been moving sideways with slight bearish tendency. Recent bearish consolidations have been maintained within the depicted daily movement channel since June 2018. On November 13, the EUR/USD demonstrated recent bullish recovery around 1.1220-1.1250 where the lower limit of the channel as well as the depicted demand zone came to meet the pair. Quick bullish advancement was demonstrated towards 1.1420. To be noted that prominent supply zone as well as the previous wave high are located around 1.1420-1.1520. Bullish fixation above 1.1420 is needed to enhance further bullish movement towards 1.1520. However, the market has demonstrated significant bearish rejection around 1.1420 few times so far. The EUR/USD pair remains under bearish pressure below 1.1420. Thus, the pair remains trapped between 1.1420 and 1.1270 until breakout occurs in either direction. Bullish fixation above 1.1420 enhances further bullish advancement towards 1.1520 and 1.1610. On the other hand, if early bearish breakout below 1.1270 is achieved on lower timeframes, a quick bearish decline should be expected towards 1.1150-1.1100. Intraday technical levels and trading recommendations for GBP/USD for December 5, 2018 2018-12-05 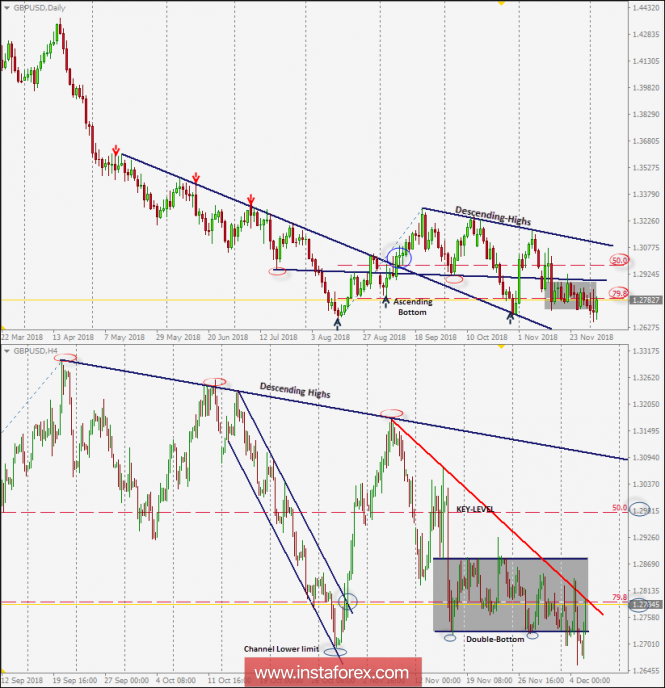
On October 30, the GBP/USD pair looked oversold around the lower limit of the H4 channel around 1.2700 where profitable BUY entries were suggested. A Quick bullish movement was demonstrated towards the price level of 1.3170-1.3200 where another descending high around the depicted downtrend was established. This initiated the current bearish pullback towards the depicted consolidation-zone of (1.2750-1.2880) where the current sideway movement within the depicted H4 channel was initiated. Recently, the GBP/USD pair failed to establish a successful bullish breakout above the price level of 1.2880 (the upper limit of the current consolidation range). This week, unsuccessful bearish breakout attempts were demonstrated below 1.2720. Moreover, signs of bullish recovery originated around 1.2670 earlier Today. Bullish persistence above 1.2780 (78.6% Fibo level) is mandatory to enhance the bullish side of the market towards 1.2880 and 1.2940 where new trading decisions should be taken upon price action. On the other hand, the current scenario may pursue a bearish flag continuation pattern provided that bearish persistence below 1.2730 is achieved on lower timeframes quickly. Projected target for the bearish flag continuation pattern is initially located around 1.2600.
Author's today's articles: Petar Jacimovic  Petar was born on July 08, 1989 in Serbia. Graduated from Economy University and after has worked as a currency analyst for large private investors. Petar has been involved in the world of finance since 2007. In this trading he specializes in Volume Price Action (volume background, multi Fibonacci zones, trend channels, supply and demand). He also writes the market analytical reviews for Forex forums and websites. Moreover Petar is forex teacher and has wide experience in tutoring and conducting webinars. Interests : finance, travelling, sports, music "The key to success is hard work" Petar was born on July 08, 1989 in Serbia. Graduated from Economy University and after has worked as a currency analyst for large private investors. Petar has been involved in the world of finance since 2007. In this trading he specializes in Volume Price Action (volume background, multi Fibonacci zones, trend channels, supply and demand). He also writes the market analytical reviews for Forex forums and websites. Moreover Petar is forex teacher and has wide experience in tutoring and conducting webinars. Interests : finance, travelling, sports, music "The key to success is hard work" Mourad El Keddani  Was born in Oujda, Morocco. Currently lives in Belgium. In 2003 obtained B.S. in Experimental Sciences. In 2007 obtained a graduate diploma at Institut Marocain Specialise en Informatique Applique (IMSIA), specialty – Software Engineering Analyst. In 2007–2009 worked as teacher of computer services and trainer in a professional school specializing in computer technologies and accounting. In 2005 started Forex trading. Authored articles and analytical reviews on Forex market on Forex websites and forums. Since 2008 performs Forex market research, and develops and implements his own trading strategies of Forex analysis (especially in Forex Research & Analysis, Currency Forecast, and Recommendations and Analysis) that lies in: Numerical analysis: Probabilities, equations and techniques of applying Fibonacci levels. Classical analysis: Breakout strategy and trend indicators. Uses obtained skills to manage traders' accounts since 2009. In April 2009 was certified Financial Technician by the International Federation of Technical Analysts. Winner of several social work awards: Education Literacy and Non-Formal Education (in Literacy and Adult Education in The National Initiative for Human Development). Was born in Oujda, Morocco. Currently lives in Belgium. In 2003 obtained B.S. in Experimental Sciences. In 2007 obtained a graduate diploma at Institut Marocain Specialise en Informatique Applique (IMSIA), specialty – Software Engineering Analyst. In 2007–2009 worked as teacher of computer services and trainer in a professional school specializing in computer technologies and accounting. In 2005 started Forex trading. Authored articles and analytical reviews on Forex market on Forex websites and forums. Since 2008 performs Forex market research, and develops and implements his own trading strategies of Forex analysis (especially in Forex Research & Analysis, Currency Forecast, and Recommendations and Analysis) that lies in: Numerical analysis: Probabilities, equations and techniques of applying Fibonacci levels. Classical analysis: Breakout strategy and trend indicators. Uses obtained skills to manage traders' accounts since 2009. In April 2009 was certified Financial Technician by the International Federation of Technical Analysts. Winner of several social work awards: Education Literacy and Non-Formal Education (in Literacy and Adult Education in The National Initiative for Human Development).
Languages: Arabic, English, French and Dutch.
Interests: Algorithm, Graphics, Social work, Psychology and Philosophy. Mohamed Samy  Born November 18, 1966, in Egypt. In 1990 graduated from the Faculty Of Engineering, Alexandria University. In 2000 started to follow financial markets. Took a higher diploma in investing and finance in 2008 and also CMT in 2009. Started at the Financial World as an analyst, then worked as a technical analysis consultant at Misr Financial Investments Co. Since 2005 has been working on the Stock Exchange. Has been familiar with Forex since December 2005. Being a member of the Egyptian Society of Technical Analysis, attends seminars and conferences dedicated to financial markets. Is a member of the American Market Technicians Association. Interests: football, reading, volleyball, swimming, movies Born November 18, 1966, in Egypt. In 1990 graduated from the Faculty Of Engineering, Alexandria University. In 2000 started to follow financial markets. Took a higher diploma in investing and finance in 2008 and also CMT in 2009. Started at the Financial World as an analyst, then worked as a technical analysis consultant at Misr Financial Investments Co. Since 2005 has been working on the Stock Exchange. Has been familiar with Forex since December 2005. Being a member of the Egyptian Society of Technical Analysis, attends seminars and conferences dedicated to financial markets. Is a member of the American Market Technicians Association. Interests: football, reading, volleyball, swimming, movies
Subscription's options management Theme's:
Fundamental analysis, Fractal analysis, Wave analysis, Technical analysis, Stock Markets
Author's :
Alexandros Yfantis, Arief Makmur, Dean Leo, Oscar Ton, Michael Becker, Mohamed Samy, Mourad El Keddani, Petar Jacimovic, Rocky Yaman, Sebastian Seliga, Torben Melsted
Edit data of subscription settings
Unsubscribe from the mailing list Sincerely,
Analysts Service | If you have any questions, you can make a phone call using one of the
InstaForex Toll free numbers right now:
|  | InstaForex Group is an international brand providing online trading services to the clients all over the world. InstaForex Group members include regulated companies in Europe, Russia and British Virgin Islands. This letter may contain personal information for access to your InstaForex trading account, so for the purpose of safety it is recommended to delete this data from the history. If you have received this letter by mistake, please contact InstaForex Customer Relations Department. |


No comments:
Post a Comment