| Elliott wave analysis of EUR/JPY for December 5, 2018 2018-12-05 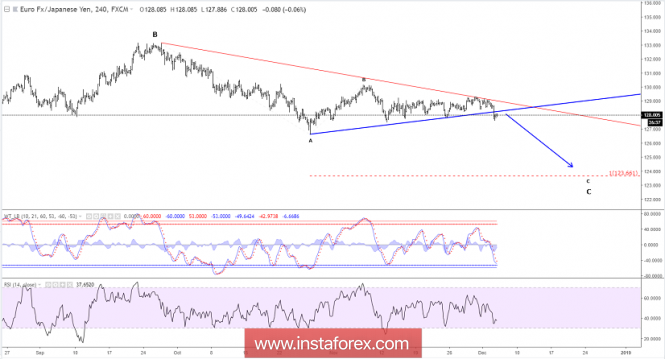
EUR/JPY failed to push above resistance at 129.23 and has instead broken below support at 128.30, which has reinstated our prior bearish view for a decline towards at least 125.75 and possibly even lower to 123.66 to complete wave C and (E) of the 10 year long triangle consolidation. Resistance is now seen near 128.45. This resistance will ideally cap the upside for a decline through support at 127.77 for more downside pressure towards 125.75. R3: 129.15 R2: 128.89 R3: 128.45 Pivot: 127.87 S1: 127.47 S2: 127.25 S3: 126.62 Trading recommendation: Our stop at 128.00 has been hit. We will stay sidelined for now. Elliott wave analysis of EUR/NZD for December 5, 2018 2018-12-05 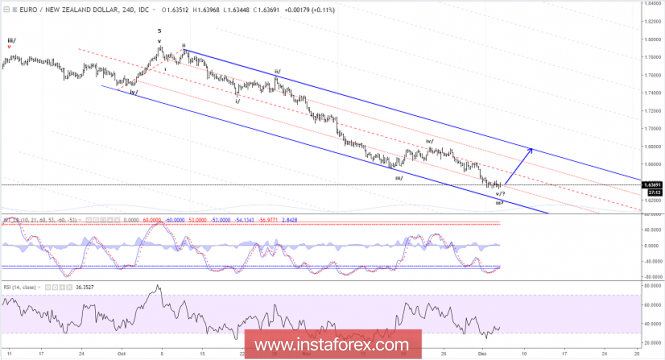
We continue to look for evidence, that the decline from 1.7929 has found a temporary bottom for a corrective rally towards at least 1.6707 and maybe even higher. To confirm that a low has been seen, we need to see a clear break above 1.6396 that will call for a rally to 1.6624 as the first hurdle on the way higher to 1.6707. As long as resistance at 1.6396 is able to cap the upside, we need to allow for a final spike to just below 1.6330, but the clear loss of downside momentum, indicates a low should be seen shortly. R3: 1.6624 R2: 1.6471 R1: 1.6396 Pivot: 1.6375 S1: 1.6330 S2: 1.6298 S3: 1.6237 Trading recommendation: We will buy EUR upon a break above resistance at 1.6396 Technical analysis for EUR/USD for December 5, 2018 2018-12-05 EUR/USD showed strength early in the day yesterday but at the end of the day the break out above 1.14-1.1420 was gone and prices were challenging and breaking below daily lows. This reversal and fake breakout is a bearish, but as long as price holds above 1.13 bulls still have hopes. 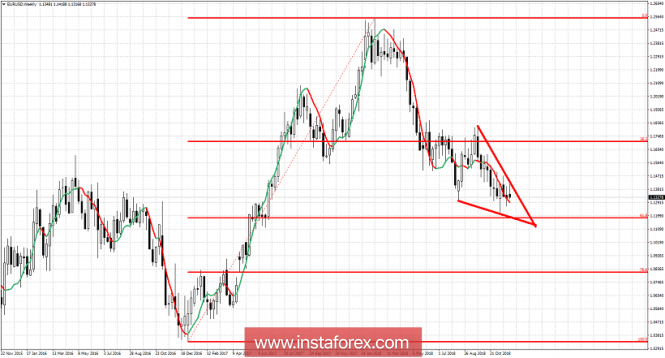
Today we take a look at the weekly chart of EUR/USD. The decline that started at 1.2550 has stopped at the 61.8% Fibonacci retracement. Recent weekly price action shows a falling wedge formation. Price remains trapped inside the boundaries of the wedge and as long as there is no break out to the upside, a move to new short-term lows towards 1.12 are very possible. Breaking and closing above 1.14-1.1420 would be a break out signal and a bullish sign implying that the entire downward move from 1.2550 might be complete. Longer-term trend remains bearish from 1.2550 and will change only with the break out of the wedge pattern. The 61.8% Fibonacci level offers a great level for a reversal. So far we have seen a bounce from 1.1215 to 1.1475 but still inside the boundaries of this pattern. Bulls will need to break above 1.1475 for a confirmation of the breakout. Technical analysis for Gold for December 5, 2018 2018-12-05 Gold price is moving higher as expected after breaking above $1,230. Short-term trend remains bullish as price challenges the October highs. Price got rejected at the October highs and is pulling back. There no change in short-term trend as long as price remains inside the bullish channel. 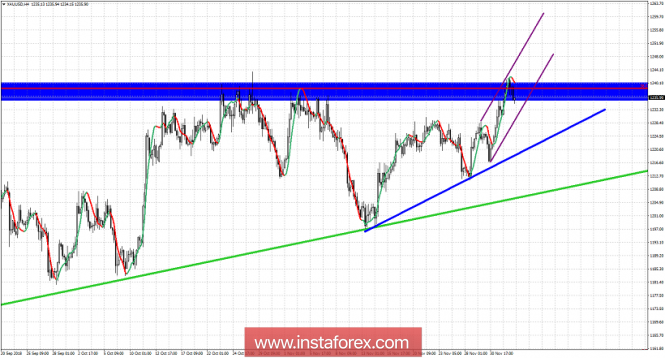
Blue rectangle - major resistance Green line - major trend line support Blue line - short-term trend line support Purple channel - bullish short-term channel Gold price is making higher highs and higher lows. Price remains in a short-term channel respecting support levels so far. The most probable outcome would be a break to new short-term highs towards $1,250-60 area. As long as price is above the green trend line the medium-term bullish trend started back in August lows is safe. Short-term critical support is at the blue trend line. Bulls do not want to see the support at $1,220 broken.
Author's today's articles: Torben Melsted  Born in November 1962. Graduated from CBS, got Diploma in Finance. Began trading on Forex in 1986 and since that time held various positions such as advising clients, hedging client flows on FX and commodity markets. Also worked for major corporations as Financial Risk Manager. Uses Elliott wave analysis in combination with classic technical analysis, and has been using a Calmar Ratio of 5.0 for over 3 years. Has his own blog, where he uses Elliott wave and technical analysis on all financial markets. Born in November 1962. Graduated from CBS, got Diploma in Finance. Began trading on Forex in 1986 and since that time held various positions such as advising clients, hedging client flows on FX and commodity markets. Also worked for major corporations as Financial Risk Manager. Uses Elliott wave analysis in combination with classic technical analysis, and has been using a Calmar Ratio of 5.0 for over 3 years. Has his own blog, where he uses Elliott wave and technical analysis on all financial markets. Alexandros Yfantis  Alexandros was born on September 14, 1978. He graduated from the ICMA Centre, University of Reading with the MSc in International Securities, investment and Banking in 2001. In 2000, Alexandros got the BSc in Economics and Business Finance from Brunel University, UK. In 2004, he began trading on the Greek stock market, where Alexandros got a specialization in international derivatives. Alexandros Yfantis has worked in a top financial company in Greece, responsible for the day-to-day running of the International markets department. He is a certified Portfolio Manager and a certified Derivatives Trader. Alexandros is also a contributor and analyst using Elliott wave and technical analysis of global financial markets. In 2007, he started Forex trading. He loves his profession and believes that entering a trade should always be accompanied by money management rules. His goal is to find profitable opportunities across the markets while minimizing risk and maximizing potential profit. "I'm still learning" Michelangelo Alexandros was born on September 14, 1978. He graduated from the ICMA Centre, University of Reading with the MSc in International Securities, investment and Banking in 2001. In 2000, Alexandros got the BSc in Economics and Business Finance from Brunel University, UK. In 2004, he began trading on the Greek stock market, where Alexandros got a specialization in international derivatives. Alexandros Yfantis has worked in a top financial company in Greece, responsible for the day-to-day running of the International markets department. He is a certified Portfolio Manager and a certified Derivatives Trader. Alexandros is also a contributor and analyst using Elliott wave and technical analysis of global financial markets. In 2007, he started Forex trading. He loves his profession and believes that entering a trade should always be accompanied by money management rules. His goal is to find profitable opportunities across the markets while minimizing risk and maximizing potential profit. "I'm still learning" Michelangelo
Subscription's options management Theme's:
Fundamental analysis, Fractal analysis, Wave analysis, Technical analysis, Stock Markets
Author's :
Alexandros Yfantis, Arief Makmur, Dean Leo, Oscar Ton, Michael Becker, Mohamed Samy, Mourad El Keddani, Petar Jacimovic, Rocky Yaman, Sebastian Seliga, Torben Melsted
Edit data of subscription settings
Unsubscribe from the mailing list Sincerely,
Analysts Service | If you have any questions, you can make a phone call using one of the
InstaForex Toll free numbers right now:
|  | InstaForex Group is an international brand providing online trading services to the clients all over the world. InstaForex Group members include regulated companies in Europe, Russia and British Virgin Islands. This letter may contain personal information for access to your InstaForex trading account, so for the purpose of safety it is recommended to delete this data from the history. If you have received this letter by mistake, please contact InstaForex Customer Relations Department. |


No comments:
Post a Comment