 |  |  | Forex Trend Analysis Report Prepared for Phan on Monday, December 3, 2018.
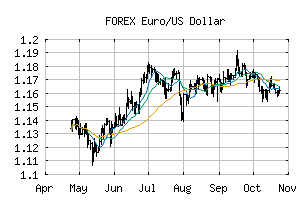
Euro/US Dollar (FOREX:EURUSD) | | Smart Scan Chart Analysis is showing some near term rallying power. However, this market remains in the confines of a longer-term Downtrend with tight money management stops. The Trade Triangle are generated using a proprietary algorithm that is comprised of weighted factors that include, but are not limited to - price change, percentage change, moving averages, and new highs/lows. The MarketClub trading strategy is based on the triangles, learn more here. |  | | Open | High | Low | EURUSD Price | Change | | 1.135250 | 1.137950 | 1.132025 | 1.133700 | -0.001550 |  | | |
MarketClub’s Trade Triangles for EURUSD  | The long term trend has been DOWN since May 1st, 2018 at 1.206420 |  | The intermediate term trend has been DOWN since Oct 2nd, 2018 at 1.152900 |  | The short term trend has been UP since Nov 29th, 2018 at 1.138365 |
Smart Scan Analysis for EURUSD Based on a pre-defined weighted trend formula for chart analysis, EURUSD scored -75 on a scale from -100 (strong downtrend) to +100 (strong uptrend). | -75 |  | | Strong Downtrend | Sideways | Strong Uptrend |
| Open | High | Low | Price | Change | | 1.135250 | 1.137950 | 1.132025 | 1.133700 | -0.001550 | | Prev. Close | Volume | Bid | Ask | Time | | 1.135250 | | 1.133600 | 1.133800 | 2018-12-03 09:22:42 |
 | | | U.S. Government Required Disclaimer - Commodity Futures Trading Commission
Futures and Options trading has large potential rewards, but also large potential risk. You must be aware of the risks and be willing to accept them in order to invest in the futures and options markets. Don't trade with money you can't afford to lose. This is neither a solicitation nor an offer to Buy/Sell futures or options. No representation is being made that any account will or is likely to achieve profits or losses similar to those discussed on this web site. The past performance of any trading system or methodology is not necessarily indicative of future results. CFTC RULE 4.41 - HYPOTHETICAL OR SIMULATED PERFORMANCE RESULTS HAVE CERTAIN LIMITATIONS. UNLIKE AN ACTUAL PERFORMANCE RECORD, SIMULATED RESULTS DO NOT REPRESENT ACTUAL TRADING. ALSO, SINCE THE TRADES HAVE NOT BEEN EXECUTED, THE RESULTS MAY HAVE UNDER-OR-OVER COMPENSATED FOR THE IMPACT, IF ANY, OF CERTAIN MARKET FACTORS, SUCH AS LACK OF LIQUIDITY. SIMULATED TRADING PROGRAMS IN GENERAL ARE ALSO SUBJECT TO THE FACT THAT THEY ARE DESIGNED WITH THE BENEFIT OF HINDSIGHT. NO REPRESENTATION IS BEING MADE THAT ANY ACCOUNT WILL OR IS LIKELY TO ACHIEVE PROFIT OR LOSSES SIMILAR TO THOSE SHOWN. All trades, patterns, charts, systems, etc., discussed are for illustrative purposes only and not to be construed as specific advisory recommendations. All ideas and material presented are entirely those of the author and do not necessarily reflect those of the publisher or INO.com. No system or methodology has ever been developed that can guarantee profits or ensure freedom from losses. No representation or implication is being made that using the MarketClub™ methodology or system will generate profits or ensure freedom from losses. The testimonials and examples used herein are exceptional results, which do not apply to the average member, and are not intended to represent or guarantee that anyone will achieve the same or similar results. Each individual's success depends on his or her background, dedication, desire, and motivation. | |
No comments:
Post a Comment