Nasdaq roars back as Wall Street breathes sigh of relief

Today was a breath of fresh air for anxious traders everywhere.

The Nasdaq soared back from a series of rough days, climbing almost four percent.

Leading the charge was Tesla, which grew almost TWENTY percent after seemingly relentless losses over the last month.

Tech is back in a big way. And if you're wondering what happens next, it's time to study a chart.
Candlesticks are capable of telling you the high price, the low price, the open and the close of a stock.

And candlestick patterns may be able to tell you a whole lot more, including what the stock is going to do next.

If any of this is a surprise, you may need a refresher on the building blocks of a trading chart.

Good thing we know just the lady to give it:

Watch Markay's candlestick class here
Clicking automatically registers you for the class and periodic updates from Markay Latimer (privacy policy)
NFTs Are All the Rage
You may have seen NFTs in the news recently, and if you're like some of us on the DPP team, you may not know exactly or even remotely what they are.

Luckily, we've done the research for you.

Check out this article for all the info you need on NFTs.
Hey everybody,

I'll be straightforward with you:

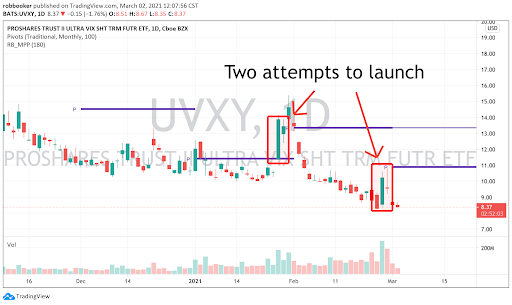
I thought that I would dive into one key indicator that you should be aware of in a choppy and unpredictable market like we are in right now, and that's the UVXY.

Now, as I'm writing this around noon eastern, the Dow is way up, the S&P is slightly up, and the Nasdaq is slightly down.

It might feel like we've fully escaped the close call last week with a bear market.

But I wouldn't be so fast.

And when you're predicting a bear market, the UVXY is your friend.

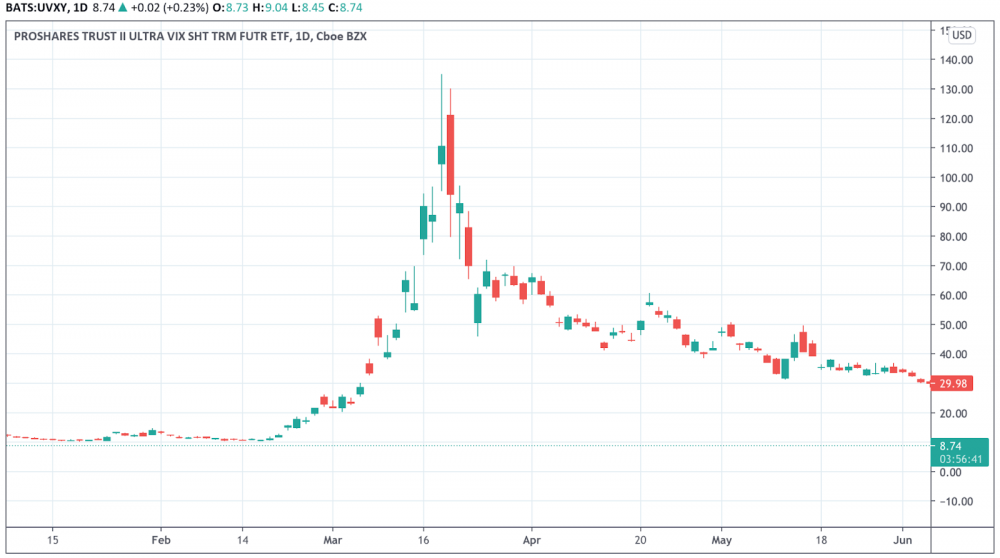
The UVXY stands for the Ultra VIX short-term Futures ETF. I bet you didn't know that, did you?

And it is an ETF (an exchange-traded fund) that tracks short-term volatility.

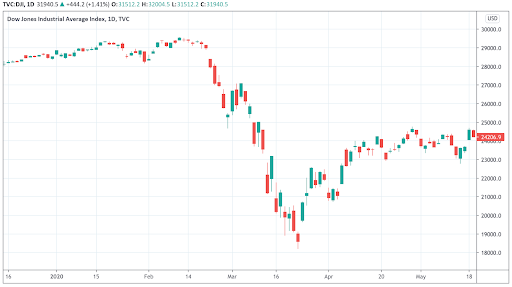
In other words, the UVXY spikes hugely when volatility greatly increases, and huge increases in volatility usually predict or correspond with big crashes in the market.

For example, here's what the UVXY looked like back in March:

And, not that you need or even really want, reminding, but here's the chart of the Dow around that same time:
The UVXY heads the opposite direction of the market.

That's valuable to us in two major ways:

First, it can serve as an indicator of when a crash or volatility is coming.

And in that department, there's something interesting to notice:

The UVXY tried to break out twice in the last month or so…

Now obviously these don't compare to the massive upward movement we saw during the height of the crisis last year, but they are still something to look out for.

We should be looking for big, green, bullish candles on the UVXY over the next month or two. If you take nothing else away from this, learn that.

But the second way you can use the UVXY is as a hedge.

Are you worried that the market is going to go down sharply and ruin all your investments? Do something about it!

There are certain tradeable assets that inversely correlated to the overall market, meaning they perform better when the market is losing, and vice versa.

Those are good assets to look at as hedges against potential market losses, and the UVXY is certainly one.

So my advice: add the UVXY to your watchlist this month and monitor it carefully. Look for those big bullish candles.

It's a good way to tell the temperature of the market.

Leveraged trading in foreign currency or off-exchange products on margin carries significant risk and may not be suitable for all investors. We advise you to carefully consider whether trading is appropriate for you based on your personal circumstances. You may lose more than you invest. We recommend that you seek independent advice and ensure you fully understand the risks involved before trading. The information on this website is intended as educational in nature and we do not recommend that you buy or sell any specific financial instrument.
 
 
Daily Profit Publishing , 1800 Hughes Landing Blvd. Ste. 200, The Woodlands, TX 77380, United States


No comments:

Post a Comment