| Elliott wave analysis of EUR/JPY for December 7, 2018 2018-12-07 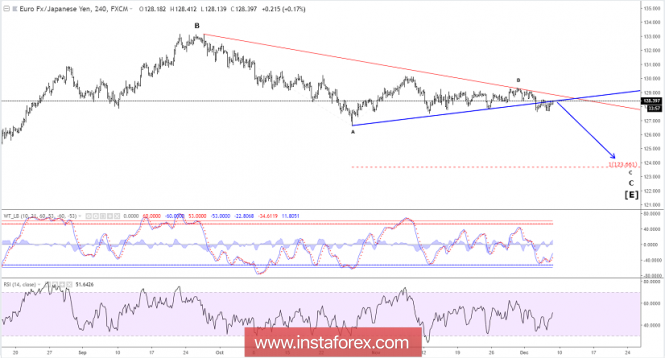
EUR/JPY remain indecisive in the 127.60 - 128.46 range and could move slightly higher to 128.50 before tuning lower again towards minimum 125.75 and ideally closer to the long-term ideal target at 123.66 to complete the 10 year triangle consolidation. Only an unexpected break above resistance at 129.05 will invalidate our bearish outlook. R3: 128.50 R2: 128.20 R1: 128.08 Pivot: 127.68 S1: 127.60 S2: 127.23 S3: 126.62 Trading recommendation: We sold EUR at 128.05 and we will place our stop at 129.10. Elliott wave analysis of EUR/NZD for December 7, 2018 2018-12-07 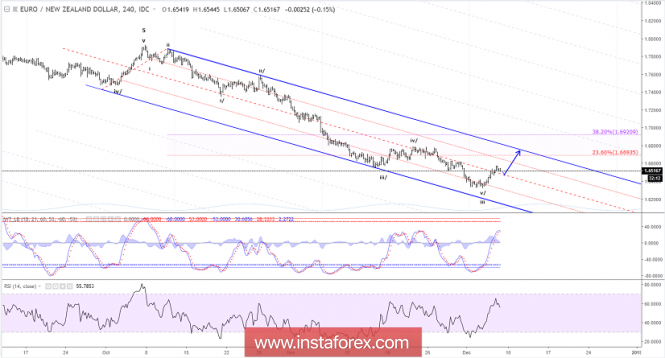
EUR/NZD has rallied nicely as wave iv. Wave a of iv likely completed with the test of 1.6575 and we should expect a temporary set-back close to 1.6423 before the next rally higher to at least 1.6668 and ideally closer to 1.6767 before being ready to turn lower in wave v. Short-term a break below minor support at 1.6511 will call for a dip to 1.6469 and ideally closer to 1.6423 in wave b of iv. R3: 1.6620 R2: 1.6575 R1: 1.6547 Pivot: 1.6511 S1: 1.6469 S2: 1.6423 S3: 1.6395 Trading recommendation: We are long EUR from 1.6400 and we will move our stop higher to 1.6510 and if done, we will try to re-buy EUR at 1.6435. Technical analysis for EUR/USD for December 7, 2018 2018-12-07 EUR/USD continues to trade near the upper triangle boundary resistance at 1.1380-1.14. Short-term trend remains neutral as long as price remains inside the triangle pattern. 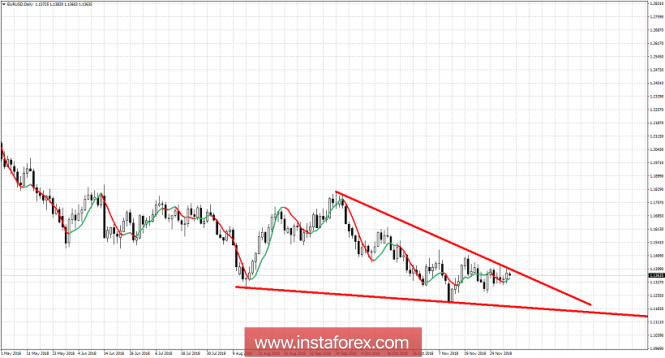
Red lines - triangle pattern EUR/USD has resistance at 1.1380-1.14 and support at 1.12 on a daily chart. Shorter-term support is found at 1.1310. If this level is broken, we expect price to move towards the lower triangle boundary at 1.12. Breaking below 1.12 would push prices even lower towards 1.08-1.09 at first. Breaking and closing above 1.14 would be a bullish sign that could push prices towards 1.15-1.16. Non-farm payrolls in the US are announced today and we expect volatility to rise after the news announcement. A break of resistance or support is highly likely today. Technical analysis for Gold for December 7, 2018 2018-12-07 Gold price has made a new higher high yesterday but price is still stuck around the 38% Fibonacci retracement level. Price is challenging the short-term bullish channel. Trend remains bullish but a break below $1,220 would bring bears back in the game. 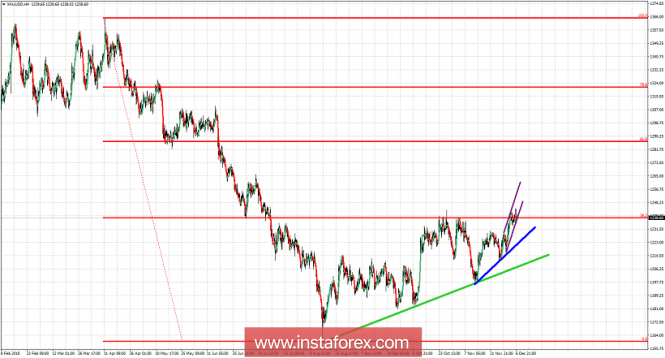
Purple lines - bullish channel Green line - major trend line support Blue line - short-term trend line support So far price is making higher highs and higher lows. As long as price is above the blue trend line support, we target $1,250-60 area. Bulls remain in control of the trend as long as price is above the green trend line. Breaking below this trend line would be a very bearish sign. Any pull back towards $1,225-30 is considered a buying opportunity with stops at $1,220-19 area. The 61.8% Fibonacci retracement level is an important target if bulls manage to stay above the 38% Fibonacci level.
Author's today's articles: Torben Melsted  Born in November 1962. Graduated from CBS, got Diploma in Finance. Began trading on Forex in 1986 and since that time held various positions such as advising clients, hedging client flows on FX and commodity markets. Also worked for major corporations as Financial Risk Manager. Uses Elliott wave analysis in combination with classic technical analysis, and has been using a Calmar Ratio of 5.0 for over 3 years. Has his own blog, where he uses Elliott wave and technical analysis on all financial markets. Born in November 1962. Graduated from CBS, got Diploma in Finance. Began trading on Forex in 1986 and since that time held various positions such as advising clients, hedging client flows on FX and commodity markets. Also worked for major corporations as Financial Risk Manager. Uses Elliott wave analysis in combination with classic technical analysis, and has been using a Calmar Ratio of 5.0 for over 3 years. Has his own blog, where he uses Elliott wave and technical analysis on all financial markets. Alexandros Yfantis  Alexandros was born on September 14, 1978. He graduated from the ICMA Centre, University of Reading with the MSc in International Securities, investment and Banking in 2001. In 2000, Alexandros got the BSc in Economics and Business Finance from Brunel University, UK. In 2004, he began trading on the Greek stock market, where Alexandros got a specialization in international derivatives. Alexandros Yfantis has worked in a top financial company in Greece, responsible for the day-to-day running of the International markets department. He is a certified Portfolio Manager and a certified Derivatives Trader. Alexandros is also a contributor and analyst using Elliott wave and technical analysis of global financial markets. In 2007, he started Forex trading. He loves his profession and believes that entering a trade should always be accompanied by money management rules. His goal is to find profitable opportunities across the markets while minimizing risk and maximizing potential profit. "I'm still learning" Michelangelo Alexandros was born on September 14, 1978. He graduated from the ICMA Centre, University of Reading with the MSc in International Securities, investment and Banking in 2001. In 2000, Alexandros got the BSc in Economics and Business Finance from Brunel University, UK. In 2004, he began trading on the Greek stock market, where Alexandros got a specialization in international derivatives. Alexandros Yfantis has worked in a top financial company in Greece, responsible for the day-to-day running of the International markets department. He is a certified Portfolio Manager and a certified Derivatives Trader. Alexandros is also a contributor and analyst using Elliott wave and technical analysis of global financial markets. In 2007, he started Forex trading. He loves his profession and believes that entering a trade should always be accompanied by money management rules. His goal is to find profitable opportunities across the markets while minimizing risk and maximizing potential profit. "I'm still learning" Michelangelo
Subscription's options management Theme's:
Fundamental analysis, Fractal analysis, Wave analysis, Technical analysis, Stock Markets
Author's :
Alexandros Yfantis, Arief Makmur, Dean Leo, Oscar Ton, Michael Becker, Mohamed Samy, Mourad El Keddani, Petar Jacimovic, Rocky Yaman, Sebastian Seliga, Torben Melsted
Edit data of subscription settings
Unsubscribe from the mailing list Sincerely,
Analysts Service | If you have any questions, you can make a phone call using one of the
InstaForex Toll free numbers right now:
|  | InstaForex Group is an international brand providing online trading services to the clients all over the world. InstaForex Group members include regulated companies in Europe, Russia and British Virgin Islands. This letter may contain personal information for access to your InstaForex trading account, so for the purpose of safety it is recommended to delete this data from the history. If you have received this letter by mistake, please contact InstaForex Customer Relations Department. |


No comments:
Post a Comment