| Elliott wave analysis of EUR/JPY for December 6, 2018 2018-12-06 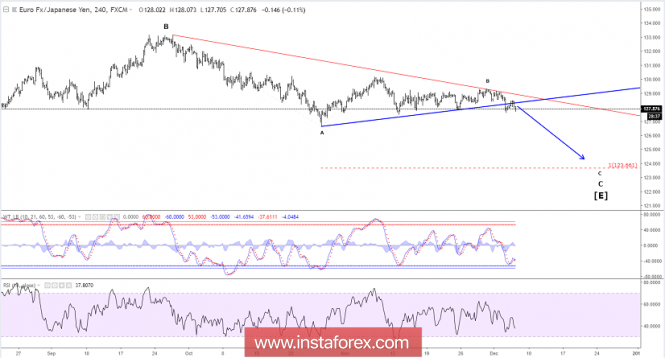
EUR/JPY should now see the resistance in the 128.08 - 128.20 area for the next decline through minor support at 127.60, that will call for a decline towards 125.75 on the way lower to the long-term target seen at 123.66. This decline should complete wave [E] of the 10 year long triangle consolidation. R3: 128.50 R2: 128.20 R1: 128.08 Pivot: 127.68 S1: 127.60 S2: 127.23 S3: 126.62 Trading recommendation: We will sell EUR at 128.05 or upon a break below 127.60 and we will place our stop at 128.60. Elliott wave analysis of EUR/NZD for December 6, 2018 2018-12-06 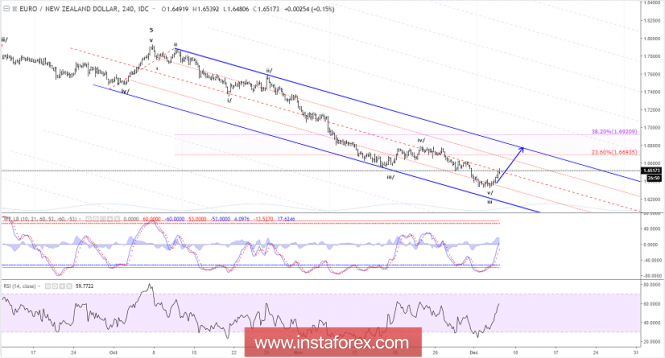
Wave iii have finally bottomed and a correction in wave iv is now expected towards at least 1.6694 and likely even closer to the peak of wave iv at 1.6767. Short-term support is now seen in the 1.6434 - 1.6464 area, which is expected to protect the downside for the rally higher to 1.6694 R3: 1.6694 R2: 1.6614 R1: 1.6540 Pivot: 1.6470 S1: 1.6464 S2: 1.6434 S3: 1.6407 Trading recommendation: We are long EUR from 1.6400 and we will place our stop at break-even. Technical analysis for EUR/USD for December 6, 2018 2018-12-06 EUR/USD remains trapped inside the triangle pattern but it is running out of space. Although the most probable outcome would be to break to the downside towards 1.12-1.11, we should not ignore the upside potential towards 1.15-1.1560. 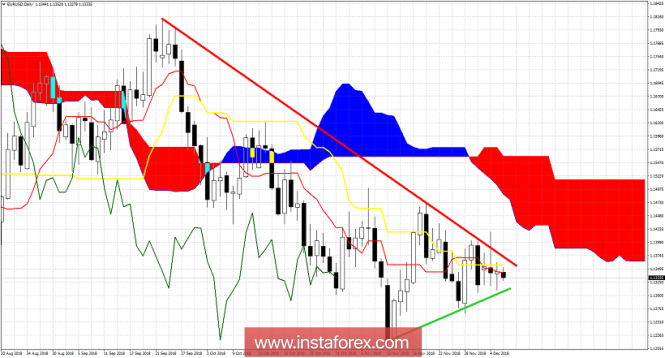
Red line- resistance Green line -support EUR/USD is trading below the Ichimoku cloud and inside a triangle pattern. Resistance is at 1.1370 and support at 1.13. Once any of these two levels is broken, we focus on the confirmation of the signal. This will come with a daily close above 1.1420 or below 1.1270. Target for the break out would be at 1.15-1.1560 for the bullish scenario and 1.12-1.1150 for the bearish scenario. Technical analysis for Gold for December 6, 2018 2018-12-06 Gold price is at the important resistance area of $1,239-43.50. Trend remains bullish in the short-term as price remains inside the bullish channel. 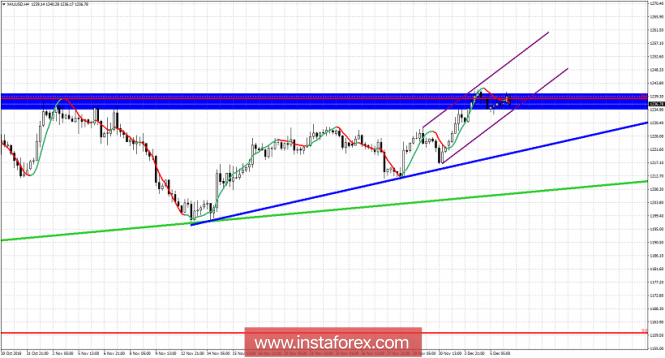
Blue area -major resistance Purple lines - bullish channel Green line -major trend line support Blue line - important short-term trend line support Gold price has not made any progress yesterday as price moved mainly sideways. Gold price remains in a bullish short-term momentum but also below major resistance area. A rejection here could bring Gold price back towards $1,220. Breaking below $1,220 would open the way for a move towards the green trend line support. Bulls are in control of the trend as long as $1,220 holds. The $1,210 low that was made at the end of November is very important support. If broken the upside will be over for Gold and I will focus on the downside.
Author's today's articles: Torben Melsted  Born in November 1962. Graduated from CBS, got Diploma in Finance. Began trading on Forex in 1986 and since that time held various positions such as advising clients, hedging client flows on FX and commodity markets. Also worked for major corporations as Financial Risk Manager. Uses Elliott wave analysis in combination with classic technical analysis, and has been using a Calmar Ratio of 5.0 for over 3 years. Has his own blog, where he uses Elliott wave and technical analysis on all financial markets. Born in November 1962. Graduated from CBS, got Diploma in Finance. Began trading on Forex in 1986 and since that time held various positions such as advising clients, hedging client flows on FX and commodity markets. Also worked for major corporations as Financial Risk Manager. Uses Elliott wave analysis in combination with classic technical analysis, and has been using a Calmar Ratio of 5.0 for over 3 years. Has his own blog, where he uses Elliott wave and technical analysis on all financial markets. Alexandros Yfantis  Alexandros was born on September 14, 1978. He graduated from the ICMA Centre, University of Reading with the MSc in International Securities, investment and Banking in 2001. In 2000, Alexandros got the BSc in Economics and Business Finance from Brunel University, UK. In 2004, he began trading on the Greek stock market, where Alexandros got a specialization in international derivatives. Alexandros Yfantis has worked in a top financial company in Greece, responsible for the day-to-day running of the International markets department. He is a certified Portfolio Manager and a certified Derivatives Trader. Alexandros is also a contributor and analyst using Elliott wave and technical analysis of global financial markets. In 2007, he started Forex trading. He loves his profession and believes that entering a trade should always be accompanied by money management rules. His goal is to find profitable opportunities across the markets while minimizing risk and maximizing potential profit. "I'm still learning" Michelangelo Alexandros was born on September 14, 1978. He graduated from the ICMA Centre, University of Reading with the MSc in International Securities, investment and Banking in 2001. In 2000, Alexandros got the BSc in Economics and Business Finance from Brunel University, UK. In 2004, he began trading on the Greek stock market, where Alexandros got a specialization in international derivatives. Alexandros Yfantis has worked in a top financial company in Greece, responsible for the day-to-day running of the International markets department. He is a certified Portfolio Manager and a certified Derivatives Trader. Alexandros is also a contributor and analyst using Elliott wave and technical analysis of global financial markets. In 2007, he started Forex trading. He loves his profession and believes that entering a trade should always be accompanied by money management rules. His goal is to find profitable opportunities across the markets while minimizing risk and maximizing potential profit. "I'm still learning" Michelangelo
Subscription's options management Theme's:
Fundamental analysis, Fractal analysis, Wave analysis, Technical analysis, Stock Markets
Author's :
Alexandros Yfantis, Arief Makmur, Dean Leo, Oscar Ton, Michael Becker, Mohamed Samy, Mourad El Keddani, Petar Jacimovic, Rocky Yaman, Sebastian Seliga, Torben Melsted
Edit data of subscription settings
Unsubscribe from the mailing list Sincerely,
Analysts Service | If you have any questions, you can make a phone call using one of the
InstaForex Toll free numbers right now:
|  | InstaForex Group is an international brand providing online trading services to the clients all over the world. InstaForex Group members include regulated companies in Europe, Russia and British Virgin Islands. This letter may contain personal information for access to your InstaForex trading account, so for the purpose of safety it is recommended to delete this data from the history. If you have received this letter by mistake, please contact InstaForex Customer Relations Department. |


No comments:
Post a Comment