| Elliott wave analysis of EUR/JPY for December 3, 2018 2018-12-03 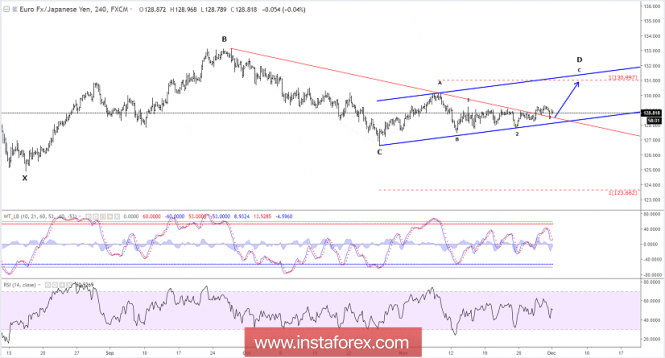
We continue to look for wave D moving higher towards the 130.89 - 130.99 resistance zone before a possible minor peak is in place and a final dip in wave E sets in. A strong break above resistance at 129.23 confirms the expected rally into the 130.89 - 130.99 target zone for wave D. Support is now seen at 128.62 and important short-term support is located at 128.23, which needs to protect the downside to keep this count alive. R3: 130.89 R2: 130.06 R1: 129.62 Pivot: 129.25 S1: 128.84 S2: 128.64 S3: 128.22 Trading recommendation: We are long EUR from 129.25 with our stop placed at 128.00. Elliott wave analysis of EUR/NZD for December 3, 2018 2018-12-03 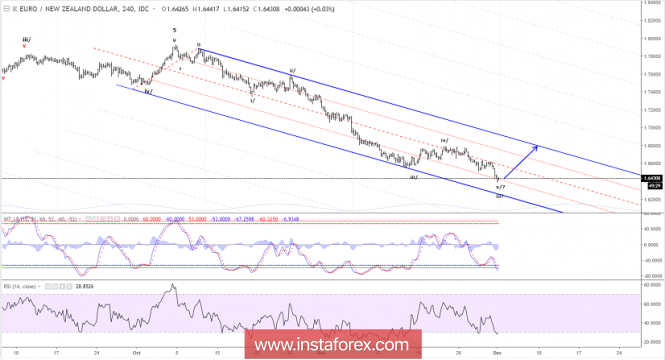
EUR/NZD has extended its decline and has tested 1.6384 as its lowest point. We currently see positive divergence between the 1.6384 low and the 1.6553 low. This indicate a loss of downside momentum, but to indicate a low is in place, we need a break above minor resistance at 1.6477 and more importantly a break above resistance at 1.6542 that calls for a rally back towards resistance near 1.6767. As long as minor resistance at 1.6477 is able to cap the upside, we can not exclude more downside pressure, but the loss of downside momentum indicates a limited downside pressure at best. R3: 1.6627 R2: 1.6542 R1: 1.6515 Pivot: 1.6477 S1: 1.6417 S2: 1.6384 S3: 1.6345 Trading recommendation: WE bought EUR at 1.6480 and we will placed our stop at 1.6380. USD/CAD Approaching Support, Prepare For A Bounce 2018-12-03 USD/CAD is approaching its support at 1.3227(100% Fibonacci extension, 23.6% Fibonacci retracement, horizontal swing low support) where it could potentially bounce to its resistance at 1.3323 (76.4% Fibonacci retracement, horizontal swing high resistance). Stochastic (55, 5, 3) is approaching its support at 4.9% where a corresponding bounce could occur. USD/CAD is approaching its support where we expect to see a bounce. Buy above 1.3227. Stop loss at 1.3179. Take profit at 1.3323. 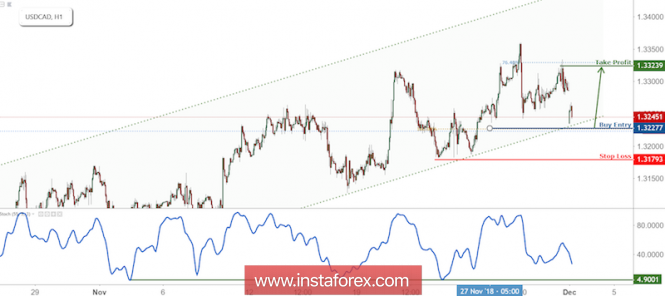
Technical analysis for Gold for December 3, 2018 2018-12-03 Gold price has made a pull back last week towards $1,217 but respected the recent low at $1,211 and is now challenging once again the recent highs and important short-term resistance at $1,230. 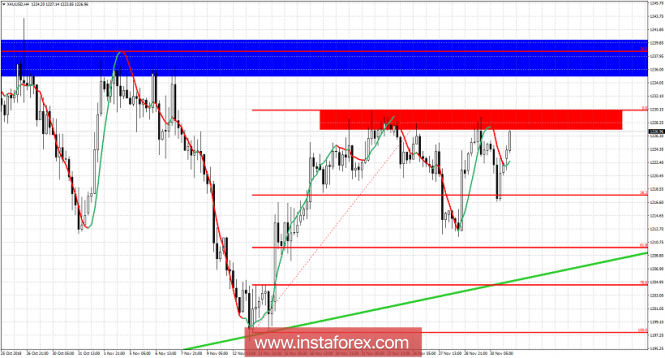
Red rectangle - important short-term resistance Blue rectangle - major resistance Green line - trend line support As we repeated in our last analysis, bulls have hopes for a break out above resistance as long as price does not break below the green trend line support. Gold's price behavior so far is supportive as price held above the 61.8% Fibonacci retracement level and despite last Friday's pull back, we see price once again challenging the important resistance area marked as red in the chart above. Bears want another rejection here and a move below $1,210. Bulls want to see a daily close above $1,230 and this will open the way for a bigger bounce towards $1,250-60. Technical analysis for EUR/USD for December 3, 2018 2018-12-03 EUR/USD got rejected at the upper trend line resistance of 1.14 on Friday and pulled back towards 1.13. Price is now bouncing back up again but so far we have no break out. Longer-term trend remains bearish. Short-term trend is neutral. 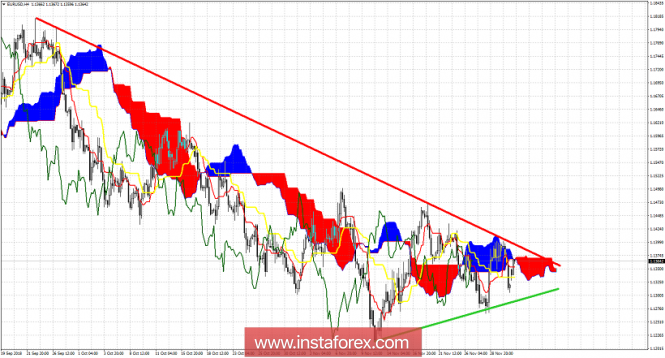
Red line - major resistance Green line - major support EUR/USD is challenging Ichimoku cloud resistance but even if it breaks above the cloud, the most important resistance to break is the red trend line. So far price has been rejected twice. Will we see a third and final rejection or will we see a breakout and a move to 1.16? As long as we trade below last week's highs bears have the upper hand. Important short-term support is found at Friday's lows. Breaking below this level will push price below the green trend line support and most probably towards 1.11-1.12. Being trapped inside this triangle offers no clear view for the medium-term trend in EUR/USD. Traders need to be patient.
Author's today's articles: Torben Melsted  Born in November 1962. Graduated from CBS, got Diploma in Finance. Began trading on Forex in 1986 and since that time held various positions such as advising clients, hedging client flows on FX and commodity markets. Also worked for major corporations as Financial Risk Manager. Uses Elliott wave analysis in combination with classic technical analysis, and has been using a Calmar Ratio of 5.0 for over 3 years. Has his own blog, where he uses Elliott wave and technical analysis on all financial markets. Born in November 1962. Graduated from CBS, got Diploma in Finance. Began trading on Forex in 1986 and since that time held various positions such as advising clients, hedging client flows on FX and commodity markets. Also worked for major corporations as Financial Risk Manager. Uses Elliott wave analysis in combination with classic technical analysis, and has been using a Calmar Ratio of 5.0 for over 3 years. Has his own blog, where he uses Elliott wave and technical analysis on all financial markets. Dean Leo  Dean Leo lives in Singapore and graduated from the prestigious Nanyang Technological University. He worked previously at Standard Chartered in the risk management team and went on to build his own proprietary trading systems. He now works at the top investment research house providing technical analysis to the largest banks and hedge funds in different countries. Dean's approach utilizes 3 components to provide detailed and easy to understand analysis: graphical elements, mathematical indicators, Elliott structure. All 3 of these components are in line to create a holistic analysis on each currency pair. Dean Leo lives in Singapore and graduated from the prestigious Nanyang Technological University. He worked previously at Standard Chartered in the risk management team and went on to build his own proprietary trading systems. He now works at the top investment research house providing technical analysis to the largest banks and hedge funds in different countries. Dean's approach utilizes 3 components to provide detailed and easy to understand analysis: graphical elements, mathematical indicators, Elliott structure. All 3 of these components are in line to create a holistic analysis on each currency pair. Alexandros Yfantis  Alexandros was born on September 14, 1978. He graduated from the ICMA Centre, University of Reading with the MSc in International Securities, investment and Banking in 2001. In 2000, Alexandros got the BSc in Economics and Business Finance from Brunel University, UK. In 2004, he began trading on the Greek stock market, where Alexandros got a specialization in international derivatives. Alexandros Yfantis has worked in a top financial company in Greece, responsible for the day-to-day running of the International markets department. He is a certified Portfolio Manager and a certified Derivatives Trader. Alexandros is also a contributor and analyst using Elliott wave and technical analysis of global financial markets. In 2007, he started Forex trading. He loves his profession and believes that entering a trade should always be accompanied by money management rules. His goal is to find profitable opportunities across the markets while minimizing risk and maximizing potential profit. "I'm still learning" Michelangelo Alexandros was born on September 14, 1978. He graduated from the ICMA Centre, University of Reading with the MSc in International Securities, investment and Banking in 2001. In 2000, Alexandros got the BSc in Economics and Business Finance from Brunel University, UK. In 2004, he began trading on the Greek stock market, where Alexandros got a specialization in international derivatives. Alexandros Yfantis has worked in a top financial company in Greece, responsible for the day-to-day running of the International markets department. He is a certified Portfolio Manager and a certified Derivatives Trader. Alexandros is also a contributor and analyst using Elliott wave and technical analysis of global financial markets. In 2007, he started Forex trading. He loves his profession and believes that entering a trade should always be accompanied by money management rules. His goal is to find profitable opportunities across the markets while minimizing risk and maximizing potential profit. "I'm still learning" Michelangelo
Subscription's options management Theme's:
Fundamental analysis, Fractal analysis, Wave analysis, Technical analysis, Stock Markets
Author's :
Alexandros Yfantis, Arief Makmur, Dean Leo, Oscar Ton, Michael Becker, Mohamed Samy, Mourad El Keddani, Petar Jacimovic, Rocky Yaman, Sebastian Seliga, Torben Melsted
Edit data of subscription settings
Unsubscribe from the mailing list Sincerely,
Analysts Service | If you have any questions, you can make a phone call using one of the
InstaForex Toll free numbers right now:
|  | InstaForex Group is an international brand providing online trading services to the clients all over the world. InstaForex Group members include regulated companies in Europe, Russia and British Virgin Islands. This letter may contain personal information for access to your InstaForex trading account, so for the purpose of safety it is recommended to delete this data from the history. If you have received this letter by mistake, please contact InstaForex Customer Relations Department. |


No comments:
Post a Comment