Upper Class Median Income 2.4 Times the Middle Class
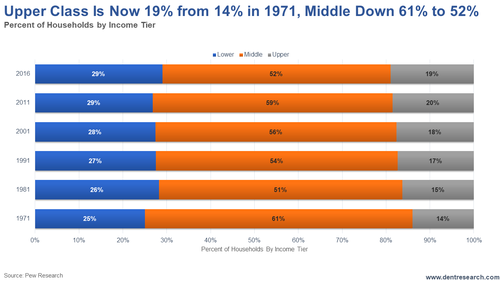
Harry Dent | September 23, 2019 | Pew Research is my favorite mainstream firm, and it has just come out with results about the status of the upper, middle, and lower class in America. As you would guess, the upper class has gained ground since 1971 while the middle and lower have lost… But not as much as the top 1% and 0.1%, who have nearly doubled their share of the income. The upper class at 19% currently has 2.4 times the median income of the middle class in 2016 vs. 2.2 times in 1970. The percent of the upper income has steadily risen since 1971 from 14% to 20% in 2011, as the chart shows. That class dropped back to 19% in 2016. 
The middle class has fallen from 61% in 1971 to 52%, and the lower class has risen from 25% to 29%. The median income statistics are the most telling. The upper class is at $187,872, a bit higher than I would have thought for median. Average incomes skewed by the exponentially richer 1% would be even higher. The middle class is $78,442. The middle class is pretty much unchanged since 2000, but has done a bit better since 2010, growing 6%. The upper income still grew higher at 9%. | Together in one room... top experts in finance, geopolitics, investing and more. Don't miss your chance to learn how you can prepare and profit from the political shifts we're likely to see over the next 18 months. Click here to reserve your seat before it's too late. | The lower class has actually fallen a bit behind from $26,923 in 2000 to $25,624 in 2016. The upper class is now 7.3 times their income vs. 6.3 times in 1970, so more of a divergence than the middle class. The highest upper-class concentrations are in the New York area and California, while the middle class is higher in the Midwest and larger parts of the Northeast. Where do you stand? The minimum income to qualify for the upper class in a one-person household is $78,281; for two people, $110,706; three, $135,586; four, $150,561; and five persons, $175,041. The minimum for the middle class by household size ranges from $26,093 to $58,347. But of course, the greatest divergence comes between the top 1%, who have benefited the most from the financial asset bubble, and the middle class. From the Pikkety study in 2014 using average income, the top 1% was $1,391,000, 33 times the middle-class average. The top 0.1% is 30 million, a whopping 719 times. Hence, the top 1% has run away with almost all of the gains, far more than the top 19% upper class! 
Harry Dent Trending Stories... The big news this week was that the Fed cut rates by around 25%. This was to be expected, though it's still a relatively big deal, and is something to take notice of with regard to a liquidity crisis on the way. On Monday the overnight borrowing rate for banks shot up to 10% (it's... The title of this piece is a play on a book, but the question stands: Will cowboys, or anyone else who buys a truck, be interested in an electric version? Ford and GM are betting their companies on it, which could be a huge mistake. A Truck-Loving Family Somewhere along the way, we became a... Today we wrap up our trio of Irrational Economic Summit preview interviews with Dent Research Senior Research Analyst Dave Okenquist. We began with Dr. Lacy Hunt and continued Monday with U.S.-China expert Gordon Chang. This final installment features a conversation between Dave and IES's keynote speaker, David Stockman. David is the former congressman, author of... My home sale recently took a weird turn when the original buyer came back to the table. Expressing regret, he has offered to make a deal better than the one I have on the table, close earlier, and remove all requests for repairs. I'm tempted, and not just because the terms make better sense. This... As I mentioned last week, we'll be running a few interviews in Economy & Markets in advance of the Irrational Economic Summit. Which this year is taking place October 10-12 at the National Harbor in Washington, D.C. (Find more info and ticket details here.) Today, Dent Research Senior Research Analyst Dave Okenquist sits down with... |
No comments:
Post a Comment